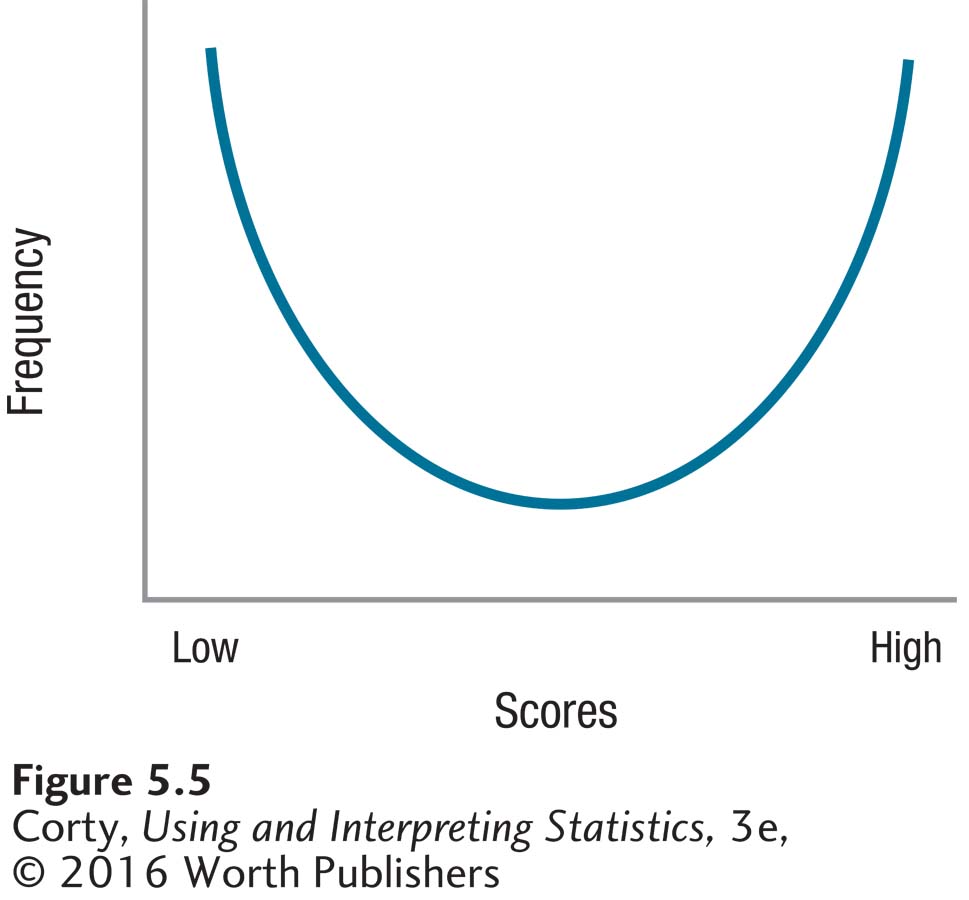
Figure 5.7: Figure 5.5 A Population That Is Not Normally Distributed This graph shows a population with a non-normal shape. According to the central limit theorem, as long as the size of the samples drawn from this population is large enough, a sampling distribution of the mean for this non-normally shaped population will have a normal distribution.