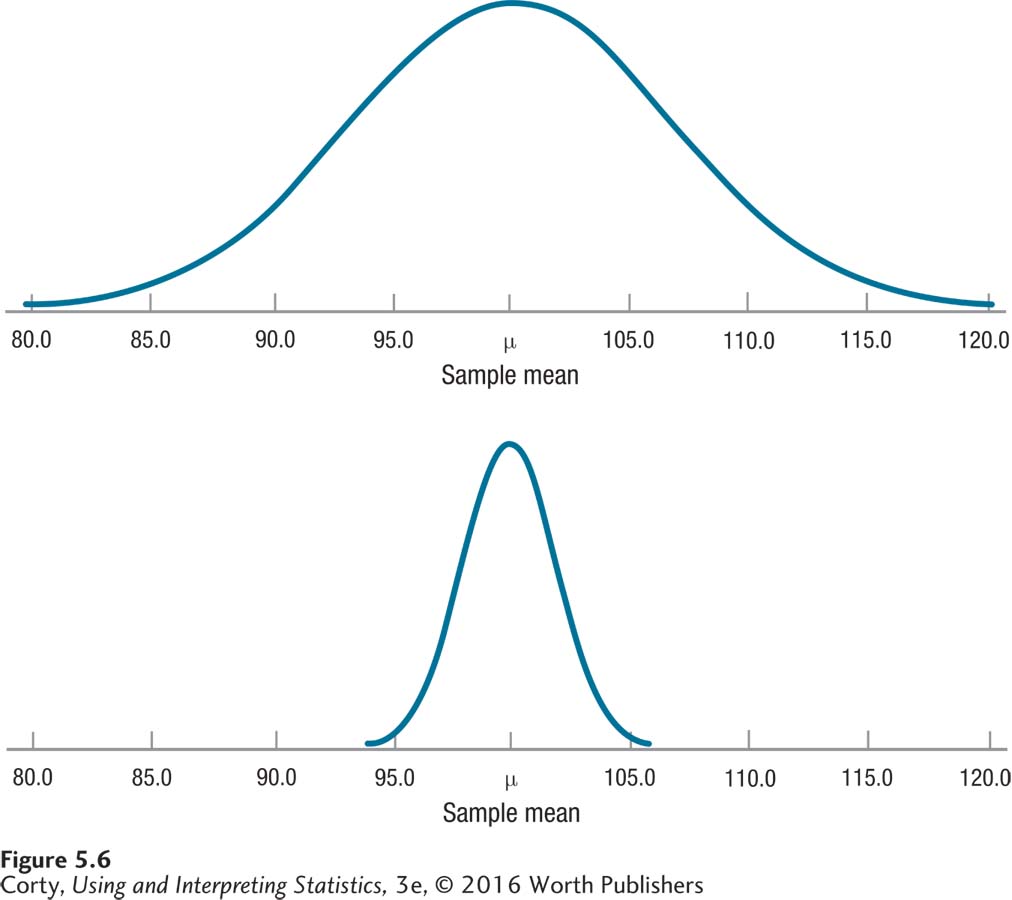
Figure 5.8: Figure 5.6 Effect of Size of Standard Error of the Mean on Sampling Distributions Both sampling distributions are from populations where μ = 100 and σ = 15. In the top panel, the sample size is smaller (N = 9), so the standard error of the mean is 5.00. In the bottom panel, the sample size is larger (N = 100), so the standard error is 1.50. Where the standard error of the mean is smaller, notice how the sampling distribution is clustered more tightly around the population mean of 100. Less sampling error occurs in the bottom panel.