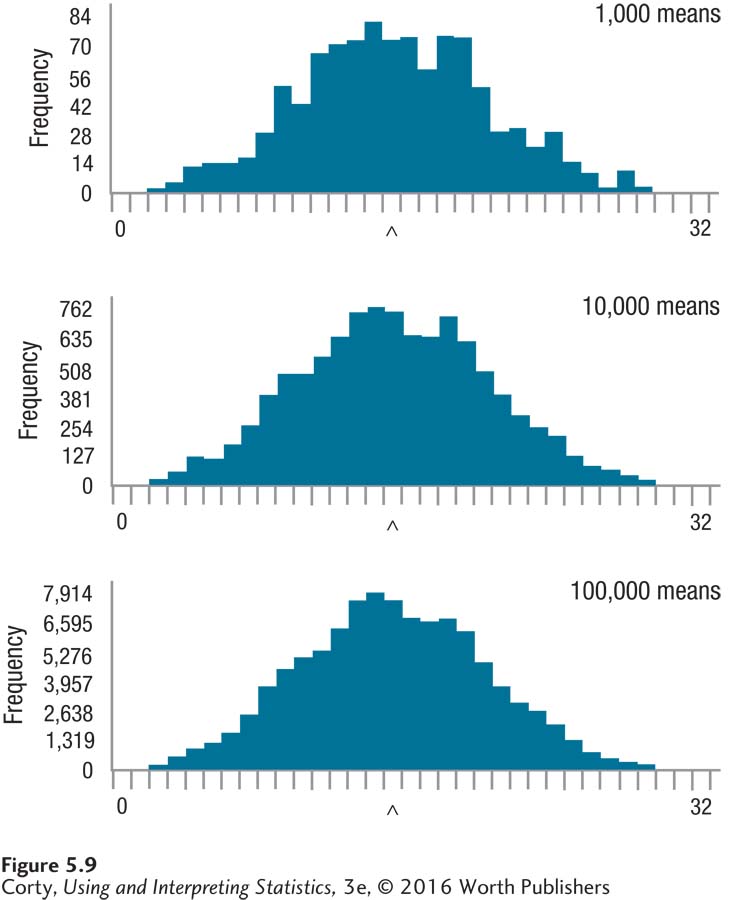
Figure 5.11: Figure 5.9 Sampling Distributions for Increasing Number of Samples of Five Cases Repeated, random samples of size N = 5 were taken from the population shown in Figure 5.7. The caret marks the population mean. A mean was calculated for each sample. The top panel shows the sampling distribution for 1,000 means, the middle panel for 10,000 means, and the bottom panel for 100,000 means. Note that the shape becomes more normal and more regular as the number of means increases. (Sampling distributions generated online at Rice Virtual Lab in Statistics.)