Figure 5.17:
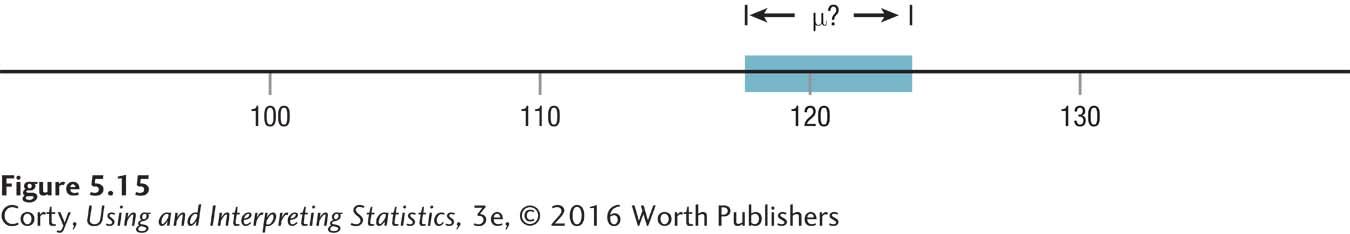
Figure 5.15
Using a Confidence Interval to Indicate the Range Within Which a Population Value Likely Falls
The shaded area indicates the range within which the mean IQ of all students at the elite college probably falls.