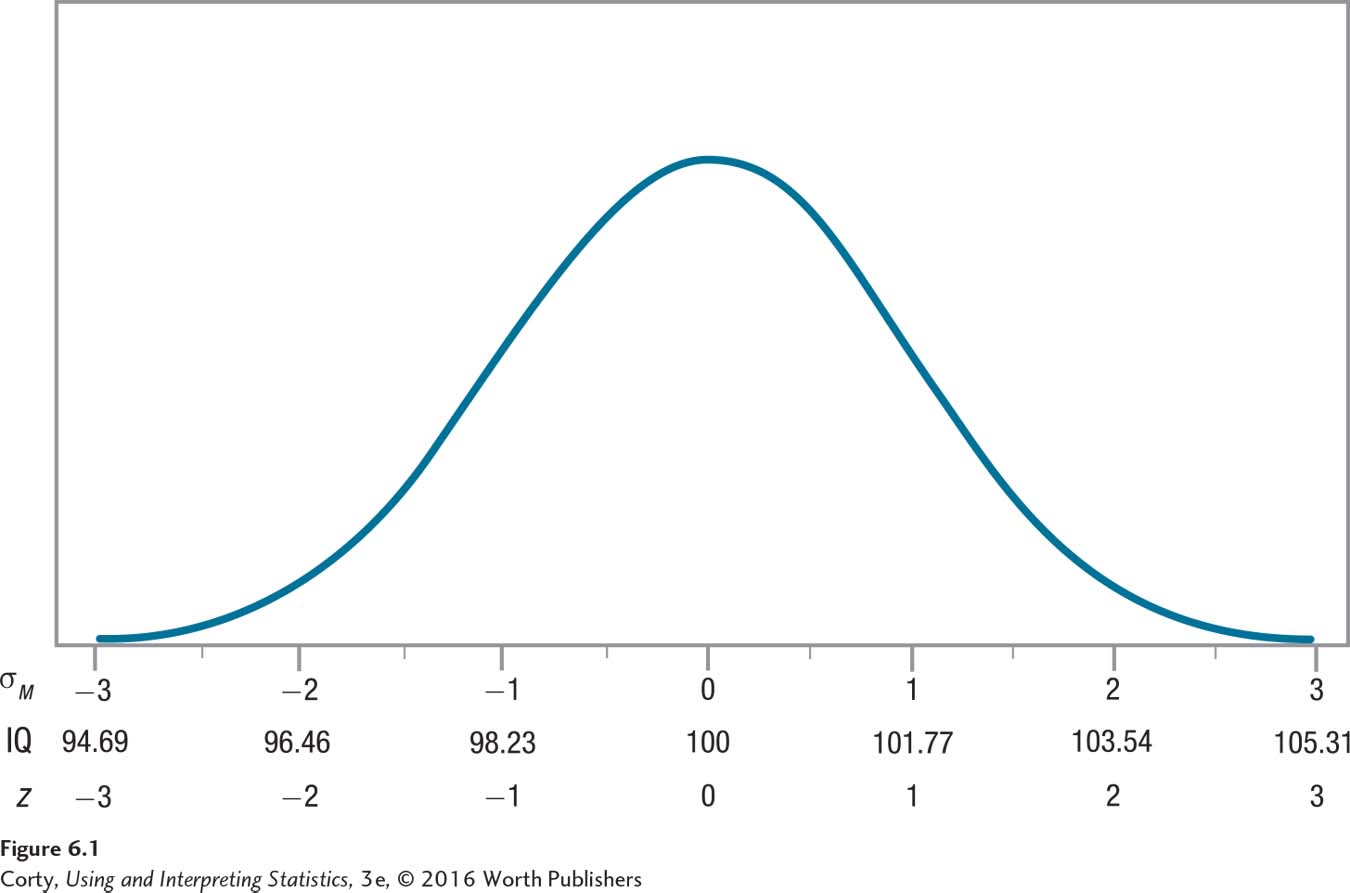
Figure 1.4: Figure 6.1 Sampling Distribution of the Mean This distribution shows what the sampling distribution of the mean would look like for repeated random samples of size 72 from a population with a mean IQ of 100. Note that it is normally distributed and centered around the population mean. The standard error of the mean, σM, is 1.77 and is being used to mark off IQ scores by standard deviation units on the X-axis.