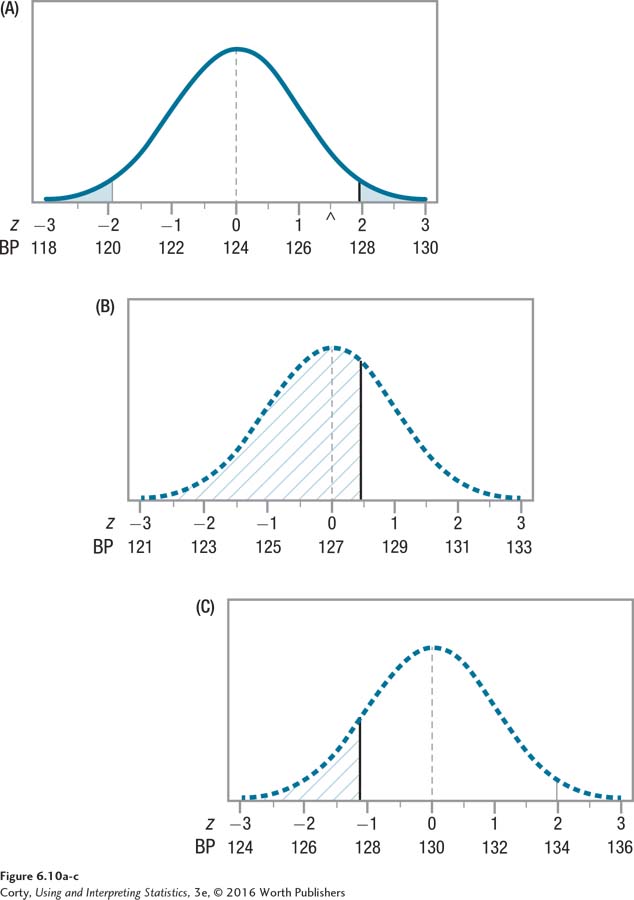
Figure 1.15: Figure 6.10 The Impact of Effect Size on the Probability of Type II Error The top panel (A) in this figure shows the sampling distribution if μ = 124, the middle panel (B) if μ = 127, and the bottom panel (C) if μ = 130. The shaded portion in the middle panel reflects beta, the probability of Type II error if it is hypothesized that the population mean is 124 but it really is 127. Note that the shaded portion in the bottom distribution, which represents beta if μ = 130, is smaller. When the effect is bigger, the probability of Type II error decreases.