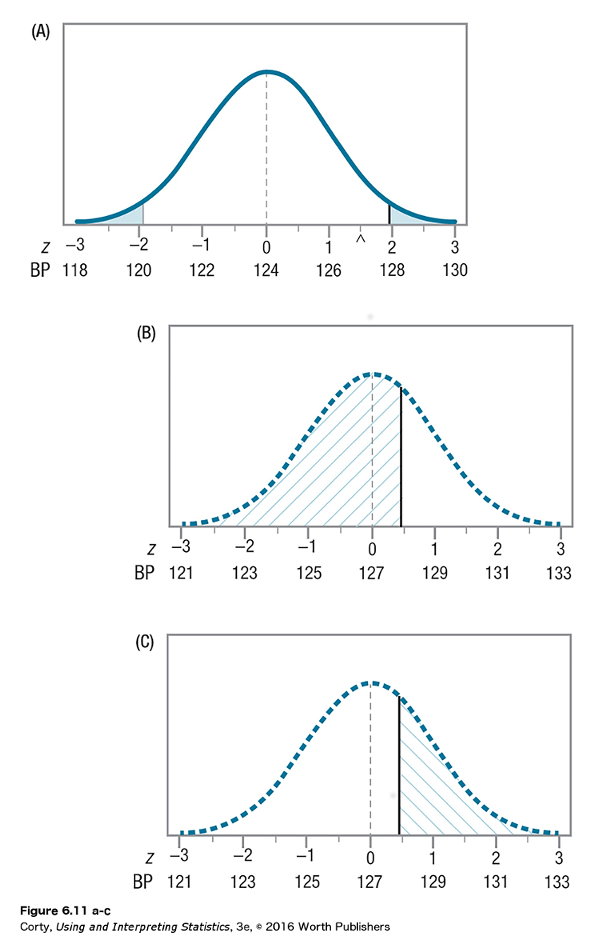
Figure 1.17 Figure 6.11 The Relationship Between Beta and Power The shaded area on the top panel (A) is the rare zone. If a result falls there, the null hypothesis will be rejected. The area hatched /// on the middle panel (B) represents beta, the probability of Type II error. The area shaded \\\ on the bottom panel (C) represents power, the likelihood if the population mean is really 127, that the null hypothesis, which claims it is 124, will be rejected. Note that the areas shaded /// and \\\ incorporate the whole distribution. (The probability of beta plus the probability of power equals 1.)