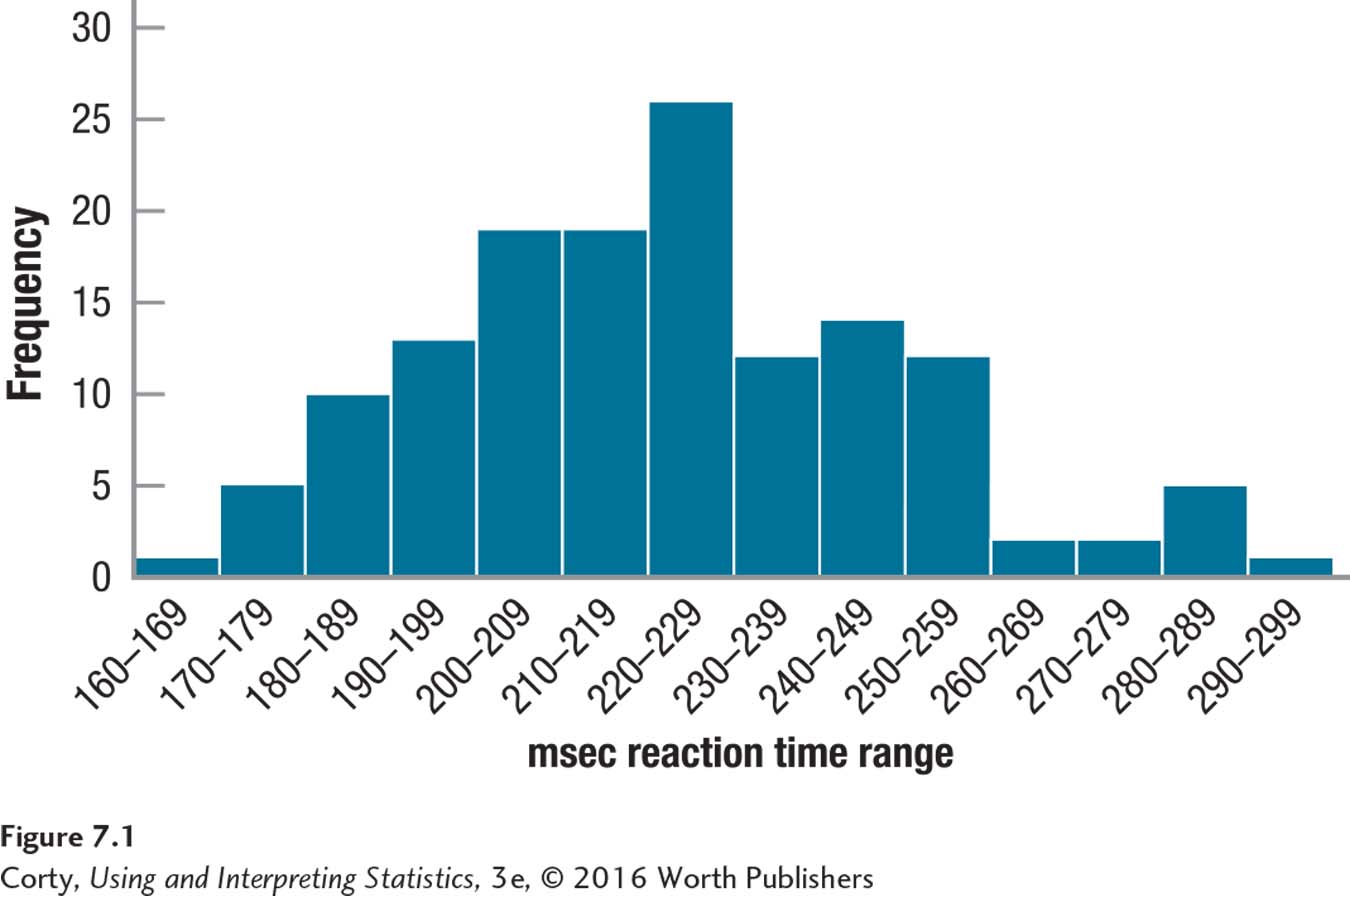
Figure 7.2: Figure 7.1 Histogram Showing Reaction Time for 141 Adults with Diagnosis of ADHD One way to check the normality assumption, if the sample size is large enough, is to make a histogram and examine it to see if it appears normally distributed. This graph of Dr. Farshad’s reaction-time data looks reasonably normal-ish.