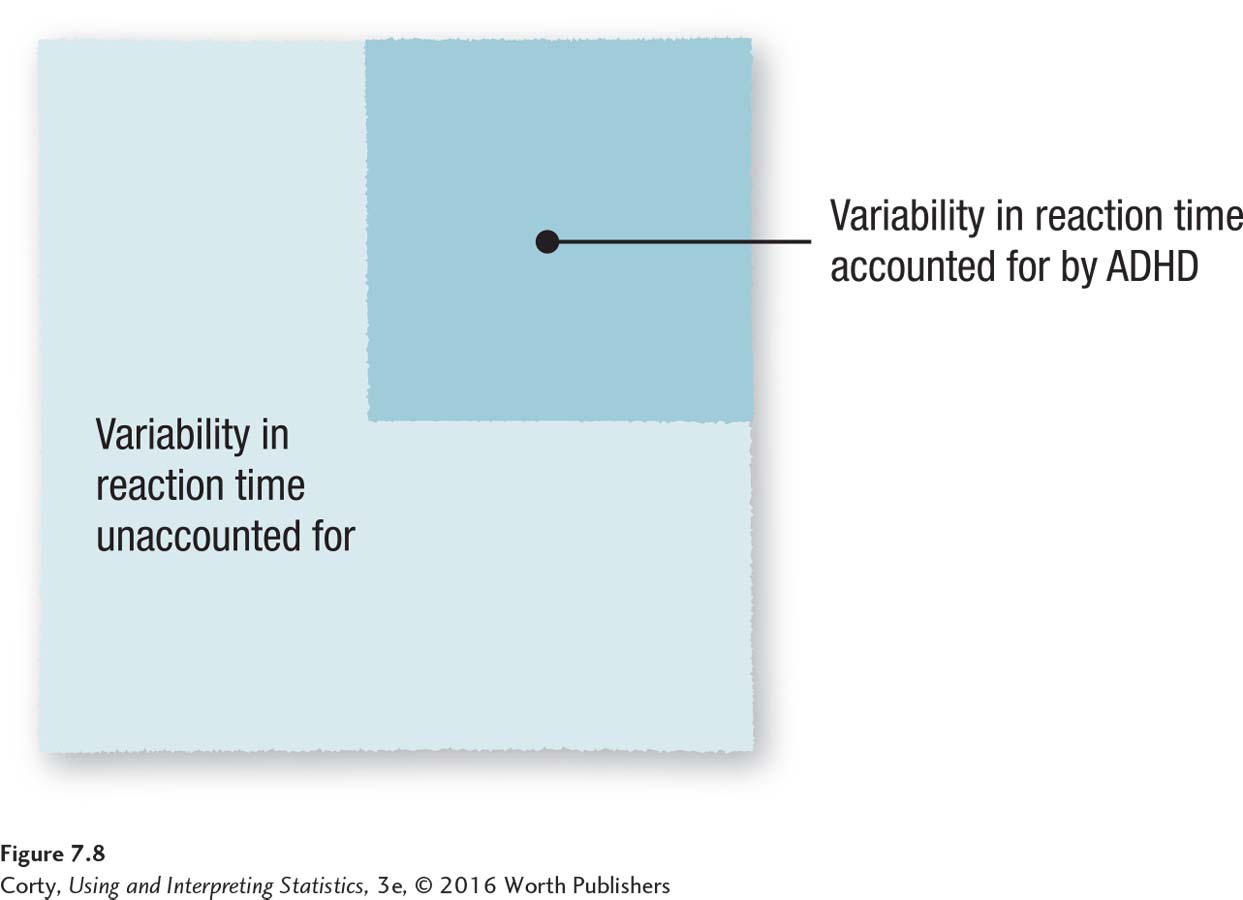
Figure 7.11: Figure 7.8 Percentage of Variability in Reaction Time Accounted for by ADHD Status The darkly shaded section of this square represents the 36% of the variability in reaction time that is accounted for by ADHD status. The nonshaded part of the square represents the 64% of variability that is still not accounted for.