CHAPTER EXERCISES
Answers to the odd-numbered exercises appear in Appendix B.
Review Your Knowledge
10.01 A ____-sample test compares the mean of one group to the mean of another group.
10.02 Analysis of variance is used when comparing the means of ____ or more groups.
10.03 ____ is short for analysis of variance.
10.04 ____, one-way ANOVA compares the means of two or more independent samples.
10.05 Other terms used for explanatory variables in ANOVA are ____ and ____.
10.06 The categories of an explanatory variable in ANOVA are called ____.
10.07 ANOVA keeps the risk of ____ error at a reasonable level.
10.08 The risk of making a Type I error ____ as the number of statistical tests being completed increases.
10.09 A follow-up test in ANOVA is called a ____ test.
10.10 A ____ is used to find out which pairs of means in an ANOVA are statistically significantly different.
370
10.11 ANOVA works by separating out the different sources of ____ in the scores.
10.12 Variability within a set of scores is called ____ variability.
10.13 Within-group variability is caused by ____.
10.14 Making a sample more homogeneous ____ within-group variability.
10.15 ____ variability is due to the different treatments different groups receive.
10.16 ____ effect is the term used to label the effect of the explanatory variable.
10.17 Between-group variability is caused by ____ as well as treatment effect.
10.18 If treatment has ____ impact on outcome, the sample means are close together.
10.19 When sample means are far apart, the treatment effect is ____.
10.20 When treatment has a large impact, there is a lot of variability between group ____.
10.21 The ratio of between-group variability to within-group variability is called an ____.
10.22 Between-group variability, the numerator in an F ratio, is made up of ____ and ____.
10.23 If treatment has no impact on outcome, the F ratio should be near ____.
10.24 As treatment has an impact on outcome, the value of the F ratio climbs above ____.
10.25 If there are just two groups, F = ____ squared.
10.26 Between-subjects, one-way ANOVA is used when there is one ____ and ____ groups.
10.27 The assumptions for between-subjects, one-way ANOVA are the same as they are for ____.
10.28 For a between-subjects, one-way ANOVA, the cases in each group should be ____ from the population.
10.29 If the cases in the groups for a between-subjects, one-way ANOVA are paired together, a between-subjects, one-way ANOVA can / cannot be used.
10.30 Between-subjects, one-way ANOVA assumes that the dependent variable in each population is ____ distributed.
10.31 The assumption that the variability in all groups is about the same is called the ____ assumption.
10.32 The null hypothesis states that there is ____ mean difference between any of the populations.
10.33 The null hypothesis for a between-subjects, one-way ANOVA is always ____ directional.
10.34 The alternative hypothesis says that at least ____ population mean is different from at least ____ other population mean.
10.35 The decision rule for a between-subjects, one-way ANOVA says that if F falls in the rare zone of the sampling distribution, the null hypothesis is ____.
10.36 The critical value of F depends on the degrees of freedom for the ____ and the degrees of freedom for the ____ of the F value.
10.37 The numerator degrees of freedom for a between-subjects, one-way ANOVA F ratio is df ____.
10.38 The denominator degrees of freedom for a between-subjects, one-way ANOVA F ratio is df ____.
10.39 In order to calculate total degrees of freedom for a between-subjects, one-way ANOVA, one could add together ____ and ____.
10.40 If F = Fcv, the null hypothesis is ____.
10.41 ∑X2 is called a ____.
10.42 Numerators in variance formulas are ____.
10.43 To calculate ____, the grand mean is subtracted from each score, the difference scores are squared, and they are all added up.
10.44 SSTotal can be broken down into two components: ____ and ____.
10.45 SSBetween isolates the variability in scores that is primarily due to ____.
10.46 SSTotal − SSBetween = ____
371
10.47 The table used to organize ANOVA results is called an ____.
10.48 The sources of variability in an ANOVA are listed in the ____ column of an ANOVA summary table.
10.49 A ____ is calculated by dividing a sum of squares by its degrees of freedom.
10.50 An F ratio in between-subjects, one-way ANOVA is calculated as the ratio of MS____ to MS____.
10.51 Interpretation of results for a statistically significant ANOVA differs from t in that it has to address where the ____ is located.
10.52 One determines if an F ratio is statistically significant by comparing F to ____.
10.53 If the null hypothesis is rejected, then ____ is accepted.
10.54 The numbers in parentheses when reporting the results of a between-subjects, one-way ANOVA in APA format are ____ and ____.
10.55 If the null hypothesis is not rejected, ANOVA results are reported in APA format as p ____ .05.
10.56 ____ is used as the effect size in between-subjects, one-way ANOVA.
10.57 r2 is calculated as the percentage of total variability in scores that is accounted for by ____ variability.
10.58 The higher the percentage of variability in the dependent variable explained by the explanatory variable, the ____ is the size of the effect.
10.59 The closer r2 is to ____%, the stronger the effect; the closer r2 is to ____%, the weaker the effect.
10.60 Cohen considers an r2 of 9% to be a ____ effect.
10.61 Post-hoc tests are only used if the ANOVA results are ____.
10.62 Some post-hoc tests have a greater likelihood of making a ____ error and others a greater chance of a ____ error.
10.63 The Tukey HSD is a conservative test. It is more likely to make a ____ error than a ____ error.
10.64 HSD stands for ____.
10.65 If the difference between two means meets or exceeds the HSD value, the difference is ____.
10.66 To find a q value, one needs to know dfWithin and ____.
10.67 The n in the HSD equation represents the sample size for the ____ group.
10.68 The HSD test is used to determine which pairs of means have a ____ difference.
Apply Your Knowledge
For the first set of questions, select the appropriate statistical test from (a) single-sample z test; (b) single-sample t test; (c) independent-samples t test; (d) paired-samples t test; (e) between-subjects, one-way ANOVA; or (f) none of the above.
10.69 An adhesives researcher tests the holding power of a wood glue under different humidities. He glues together 100 small pieces of wood and randomly assigns each one to sit for an hour in a room with either 10%, 30%, 50%, 70%, or 90% relative humidity. Each glued piece of wood is then tested to see how many pounds of weight it takes to break the glue bond. The means of the five groups are compared.
10.70 Some parents demand that their children friend them on Facebook and other parents don’t. A developmental psychologist wondered if such parental supervision had any impact on behavior. She obtained a sample of first-year college students and classified them as having parents who were or were not Facebook friends. From each student she also learned the number of days, during the first month of college, that he or she had consumed any alcohol. The two means are compared.
10.71 A nutritionist investigates the impact of type of breakfast on mid-morning concentration. He puts together a sample of 50 adults. He feeds them a breakfast and 4 hours later measures their concentration on an interval-level concentration test. On one day he feeds them bacon and eggs, on a second day he feeds them oatmeal, and on a third day he has them skip breakfast. He then calculates the mean concentration score for each condition.
372
10.72 A social psychologist is interested in how people perceive age-discrepant couples. She gets a random sample of shoppers at a mall, has them read a wedding announcement, and then asks them to predict—on an interval-level scale—the newlyweds’ degree of marital happiness after 10 years of marriage. Participants are randomly assigned to groups: one-third read an announcement in which the bride is 25 and the groom 35, one-third read an announcement in which the bride is 35 and the groom 25, and the final third read an announcement in which both bride and groom are 30.
For the next set of questions, determine if assumptions have been violated and if a between-subjects, one-way ANOVA can be completed.
10.73 A sensory psychologist wants to determine if a sensory threshold differs depending on which nostril is used. He obtains 30 introductory psychology student volunteers and measures the absolute threshold, in parts per million, for detecting the scent of peppermint. Participants are randomly assigned to three equal-size groups: (1) scent administered to the left nostril, (2) scent administered to the right nostril, and (3) scent administered to both nostrils. Each participant is tested individually by an experimenter who does not know what the hypothesis is and does not know which nostril is being used.
10.74 A biomedical engineer compared the abrasion resistance — as measured by number of rotations until failure — of three different artificial hips. Manufacturer X makes hip joints out of metal, manufacturer Y out of ceramic, and manufacturer Z out of a metal/ceramic composite. The biomedical engineer gets a random sample of 6 hips from each manufacturer’s production line and tests each one individually until failure occurs.
Writing the hypotheses
10.75 Write the null and alternative hypotheses for the between-subjects, one-way ANOVA in Exercise 10.73.
10.76 Write the null and alternative hypotheses for the between-subjects, one-way ANOVA in Exercise 10.74.
Calculating degrees of freedom
10.77 If N = 48 and k = 4, calculate (a) dfTotal, (b) dfBetween, and (c) dfWithin.
10.78 If N = 120 and k = 5, calculate (a) dfTotal, (b dfBetween, and (c) dfWithin.
10.79 If there are four independent samples, each with 15 participants, what are (a) dfTotal, (b) dfBetween, and (c) dfWithin?
10.80 If n1 = 15, n2 = 12, and n3 = 18, what are (a) dfTotal, (b) dfBetween, and (c) dfWithin?
Finding Fcv
10.81 If dfWithin = 44 and dfBetween = 2, what is Fcv if α = .01?
10.82 If dfBetween = 3 and dfWithin = 36, what is Fcv if α= .05?
10.83 If α = .05, N = 50, and k = 4, what is Fcv?
10.84 If α = .05, N = 80, and k = 5, what is Fcv?
Stating the decision rule
10.85 If dfWithin = 40 and dfBetween = 2, what is the decision rule if α = .05? Draw a sampling distribution of F and mark the rare and common zones.
10.86 If dfWithin = 10 and dfBetween = 3, what is the decision rule if α = .05? Draw a sampling distribution of F and mark the rare and common zones.
Calculating sums of squares
10.87 Prepare the data table for use by computational formulas for sums of squares.
| Group 1 | Group 2 | Group 3 |
| 108 | 100 | 99 |
| 102 | 105 | 95 |
| 91 |
10.88 Prepare the data table for use by computational formulas for sums of squares.
| Group 1 | Group 2 | Group 3 |
| 46 | 54 | 74 |
| 48 | 58 | 80 |
373
10.89 Given the data in this table, calculate SSTotal, SSBetween, and SSWithin.
| Group 1 | Group 2 | Group 3 | ||||||
| X | X2 | X | X2 | X | X2 | |||
| 112 | 12,544 | 98 | 9,604 | 88 | 7,744 | |||
| 104 | 10,816 | 90 | 8,100 | 85 | 7,225 | |||
| 88 | 7,744 | 76 | 5,776 | Grand | ||||
| 80 | X | X2 | ||||||
| ∑ | 216.00 | 23,360.00 | 276.00 | 25,448.00 | 329.00 | 27,145.00 | 821.00 | 75,953.00 |
| n | 2 | 3 | 4 | 9 | ||||
10.90 Given the data in this table, calculate SSTotal, SSBetween, and SSWithin.
| Group 1 | Group 2 | Group 3 | ||||||
| X | X2 | X | X2 | X | X2 | |||
| 55 | 3,025 | 47 | 2,209 | 68 | 4,624 | |||
| 63 | 3,969 | 58 | 3,364 | 66 | 4,356 | |||
| 72 | 5,184 | 63 | 3,969 | 62 | 3,844 | Grand | ||
| 59 | 3,481 | 48 | 2,304 | 73 | 5,329 | X | X2 | |
| ∑ | 249 | 15,659 | 216 | 11,846 | 269 | 18,153 | 734 | 45,658 |
| n | 4 | 4 | 4 | 12 | ||||
10.91 If SSTotal = 98.75 and SSBetween = 40.33, what is SSWithin?
10.92 If SSWithin = 168.43 and SSBetween = 764.13, what is SSTotal?
Calculating mean squares
10.93 If SSBetween = 2,378.99 and dfBetween = 3, what is MSBetween?
10.94 If SSBetween = 138.76 and dfBetween = 4, what is MSBetween?
10.95 If SSWithin = 78.95 and dfWithin = 32, what is MSWithin?
10.96 If SSWithin = 452.86 and dfWithin = 102, what is MSWithin?
Calculating F
10.97 If MSBetween = 38.88 and MSWithin = 17.44, what is F?
10.98 If MSWithin = 764.55 and MSBetween = 898.00, what is F?
Completing an ANOVA summary table
10.99 Complete this ANOVA summary table:
| Source of Variability | Sum of Squares | Degrees of Freedom | Mean Square | F ratio |
| Between groups | 172.80 | 2 | ||
| Within groups | 6,410.80 | 12 | ||
| Total | 6,583.60 | 14 |
10.100 Complete this ANOVA summary table:
| Source of Variability | Sum of Squares | Degrees of Freedom | Mean Square | F ratio |
| Between groups | 47,843.15 | 3 | ||
| Within groups | 3,053.88 | 30 | ||
| Total | 50,897.03 | 33 |
374
Deciding if the null hypothesis is rejected
10.101 If Fcv = 3.238, draw a sampling distribution of F, label the rare and common zones, locate F = 1.96, and determine, for this F value, if the null hypothesis should be rejected.
10.102 If Fcv = 2.337, draw a sampling distribution of F, label the rare and common zones, locate F = 5.66, and determine, for this F value, if the null hypothesis should be rejected.
10.103 If Fcv = 3.467 and F = 7.64, is the null hypothesis rejected?
10.104 If Fcv = 2.486 and F = 1.98, is the null hypothesis rejected?
Using APA format
10.105 If dfBetween = 3, dfWithin = 17, F = 5.34, and α = .05, write the results in APA format. (Use dfBetween and dfWithin to find Fcv in order to determine if the null hypothesis was rejected.)
10.106 If dfBetween = 6, dfWithin = 30, F = 2.81, and α = .05, write the results in APA format. (Use dfBetween and dfWithin to find Fcv in order to determine if the null hypothesis was rejected.)
10.107 Given this ANOVA summary table, write the results in APA format using α = .05. (Use dfBetween and dfWithin to find Fcv in order to determine if the null hypothesis was rejected.)
| Source of Variability | Sum of Squares | Degrees of Freedom | Mean Square | F ratio |
| Between groups | 59.98 | 3 | 19.99 | 3.28 |
| Within groups | 268.60 | 44 | 6.10 | |
| Total | 328.58 | 47 |
10.108 Given this ANOVA summary table, write the results in APA format using α = .05. (Use dfBetween and dfWithin to find Fcv in order to determine if the null hypothesis was rejected.)
| Source of Variability | Sum of Squares | Degrees of Freedom | Mean Square | F ratio |
| Between groups | 42.34 | 2 | 21.17 | 2.23 |
| Within groups | 1,896.22 | 200 | 9.48 | |
| Total | 1,938.56 | 202 |
Interpreting APA format
10.109 The results of a between-subjects, one-way ANOVA, in APA format, are F(3, 26) = 4.53, p < .05. What interpretative statement can one make about the differences among the four population means?
10.110 The results of a between-subjects, one-way ANOVA, in APA format, are F(3, 30) = 2.66, p > .05. What interpretative statement can one make about the differences among the four population means?
Calculating r2
10.111 If SSBetween = 128.86 and SSTotal = 413.67, what is r2?
10.112 f SSBetween = 17.48 and SSTotal = 342.88, what is r2?
10.113 Using the information in the ANOVA summary table in Exercise 10.107, calculate r2.
10.114 Using the information in the ANOVA summary table in Exercise 10.108, calculate r2.
Deciding whether to do a post-hoc test
10.115 Should a post-hoc test be completed for the results in the ANOVA summary table in Exercise 10.107?
10.116 Should a post-hoc test be completed for the results in the ANOVA summary table in Exercise 10.108?
Finding q
10.117 If k = 4 and dfWithin = 16, what is q if α?= .01?
10.118 If k = 3 and dfWithin = 26, what is q if α?= .05?
Calculating HSD
10.119 If q = 3.55, MSWithin = 10.44, and n = 8, what is HSD ?
10.120 If q = 4.05, MSWithin = 6.87, and n = 11, what is HSD ?
375
Interpreting HSD
10.121 If M1 = 13.09, M2 = 8.89, and HSD = 4.37, is the difference a statistically significant one? What conclusion would one draw about the direction of the difference between the two population means?
10.122 If M1 = 123.65, M2 = 144.56, and HSD = 10.64, is the difference a statistically significant one? What conclusion would one draw about the direction of the difference between the two population means?
10.123 If M1 = 67.86, M2 = 53.56, M3 = 61.55, and HSD = 8.30, which pairs of means have statistically significant differences? What is the direction of the differences?
10.124 If M1 = 12.55, M2 = 13.74, M3 = 5.49, and HSD = 4.44, which pairs of means have statistically significant differences? What is the direction of the differences?
Completing an interpretation (HSD values are given whether needed or not).
10.125 An addictions researcher was curious about which drug was hardest to quit: alcohol, cigarettes, or heroin. She obtained samples of alcoholics, smokers, and heroin addicts who were in treatment for the second time and found out how long they had remained abstinent, in months, after their first treatment. The mean time to relapse for the 8 alcoholics was 4.63 months; for the 11 smokers, it was 4.91 months; for the 6 heroin addicts, it was 5.17 months. Given the ANOVA summary table below, r2 = 0.66%, and HSD = 3.83, complete a four-point interpretation of the results using α = .05.
| Source of Variability | Sum of Squares | Degrees of Freedom | Mean Square | F ratio |
| Between groups | 1.02 | 2 | 0.51 | 0.07 |
| Within groups | 153.62 | 22 | 6.98 | |
| Total | 154.64 | 24 |
10.126 A sleep specialist investigated the impact of watching TV and using computers, before bedtime, on sleep onset. He obtained 30 college student volunteers and randomly assigned them to three equally sized groups: (1) work on a computer for 30 minutes before going to bed, (2) watch TV for 30 minutes before going to bed, and (3) don’t work on a computer or watch TV before bedtime. He then measured time to sleep onset (in minutes), finding means for the three groups, respectively, of 19.60, 17.40, and 5.30. Given the ANOVA summary table, r2 = 65.63%, and HSD = 5.32, complete a four-point interpretation of the results using α = .05.
| Source of Variability | Sum of Squares | Degrees of Freedom | Mean Square | F ratio |
| Between groups | 1,185.80 | 2 | 592.90 | 25.78 |
| Within groups | 620.90 | 27 | 23.00 | |
| Total | 1,806.70 | 29 |
For Exercises 10.127–10.128, complete all six steps of hypothesis testing for these data sets. Remember to keep the six steps in the right order.
10.127 A consumer researcher gave consumers a sample shampoo. After using the shampoo, each consumer used an interval-level scale to rate his or her satisfaction with it. Scores could range from 0 to 100, with higher scores indicating greater satisfaction. Consumers didn’t know each other and were randomly assigned to three groups: (1) receive a store brand of shampoo in a bottle clearly labeled as such, (2) receive a premium brand of shampoo in the premium brand’s bottle, or (3) receive a store brand of shampoo in the premium brand’s bottle. Here are the collected data:
| Store Brand, Store Bottle | Premium Brand, Premium Bottle | Store Brand, Premium Bottle | |
| 70 | 85 | 85 | |
| 65 | 90 | 80 | |
| 65 | 95 | 90 | |
| 60 | 90 | 85 | |
| M = 65.00 s = 4.08 | M = 90.00 s = 4.08 | M = 85.00 s = 4.08 | MGrand = 80.00 |
376
10.128 An environmental psychologist investigated ways to reduce waste. He randomly assigned office workers in small businesses to three groups: (1) to be in a control group, (2) to receive daily e-mail reminders about the importance of recycling, or (3) to have their current wastebaskets replaced with much smaller wastebaskets. To make sure they didn’t influence each other, each worker was selected from a different small business. At the end of the week, the psychologist measured how many pounds of office waste each person had generated. Here are the data:
| Control Group | Daily e-mail Reminders | Smaller Wastebaskets | |
| 12 | 14 | 6 | |
| 14 | 12 | 4 | |
| 18 | 10 | 8 | |
| 12 | |||
| M = 14.00 s = 2.83 | M = 12.00 s = 2.00 | M = 6.00 s = 2.00 | MGrand = 11.00 |
Expand Your Knowledge
10.129 Which of the following is in descending order of size?
SSTotal, SSWithin, SSBetween
SSTotal, SSBetween, SSWithin
SSTotal, SSWithin, MSWithin
SSWithin, SSTotal, MSWithin
MSWithin, SSWithin, SSTotal
None of the above.
10.130 If treatment has an effect, then there is:
more variability between groups than in total.
more variability within groups than in total.
more variability between groups than within groups.
more variability within groups than between groups.
None of the above.
For Exercises 10.131–10.138, indicate whether what is written could be true or is false.
10.131 F(3, 18) = 10.98, p < .05
10.132 F(3, 25) = 1.98, p < .05
10.133 F(4, 20) = −17.89, p < .05
10.134 N = 14, k = 3
10.135 N = 6, k = 8
10.136 If α = .05, q = 1.96.
10.137 SSBetween = 25, SSWithin = 10, SSTotal = 35
10.138 SSBetween = 12.50, SSWithin = 12.50, SSTotal = 25.00
SPSS
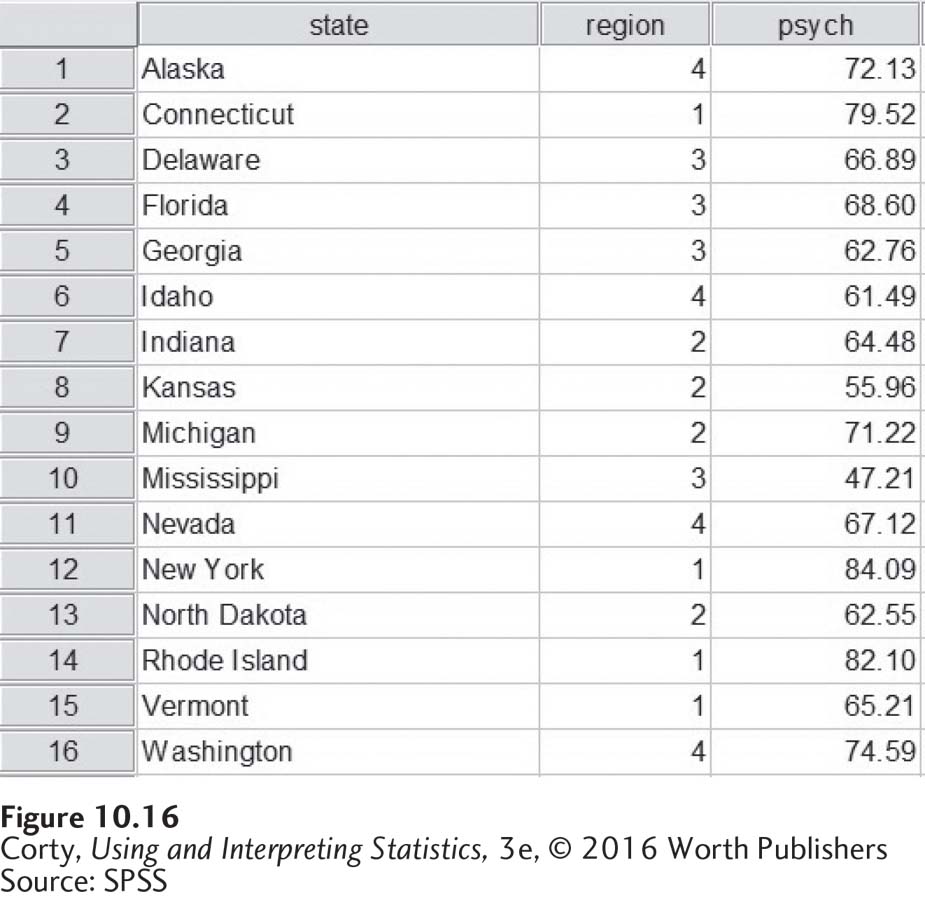
The data for a between-subjects, one-way ANOVA have to be entered in the SPSS data editor in a specific way. Figure 10.16 contains the data for psychologists’ salaries for states in the four census regions. The first column in the data editor tells which state the data come from. The second variable, the column labeled “region,” contains information about which group a case is in. Here, a 1 indicates that a case is in the Northeast, a 2 indicates the Midwest, a 3 is for cases in the South, and a 4 is for the West. Note that SPSS does not need cases in a region to be grouped together. The final variable, the column labeled “psych,” contains the cases’ scores on the dependent variable, the mean salary for the state.
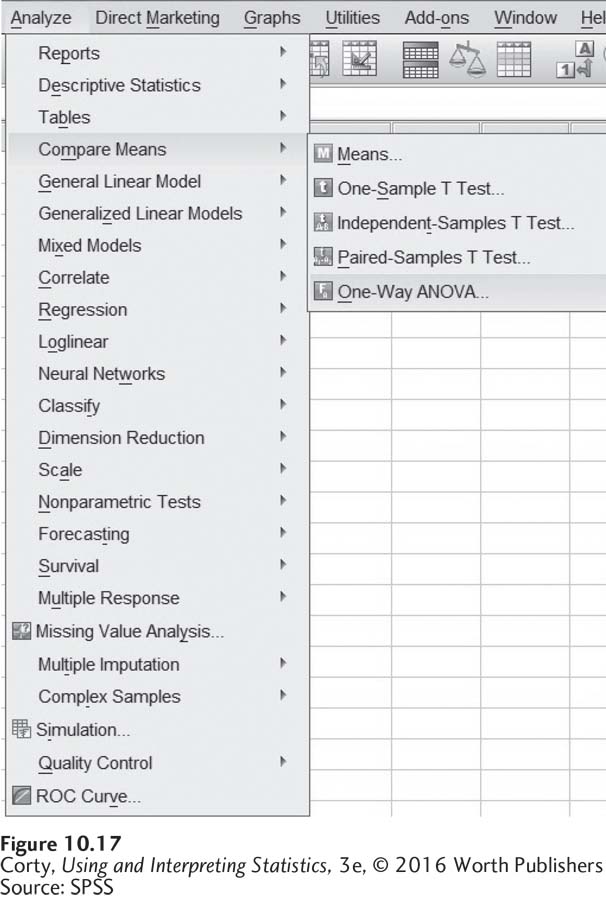
The command to start a one-way ANOVA can be found under “Analyze” and “Compare Means,” as shown in Figure 10.17.
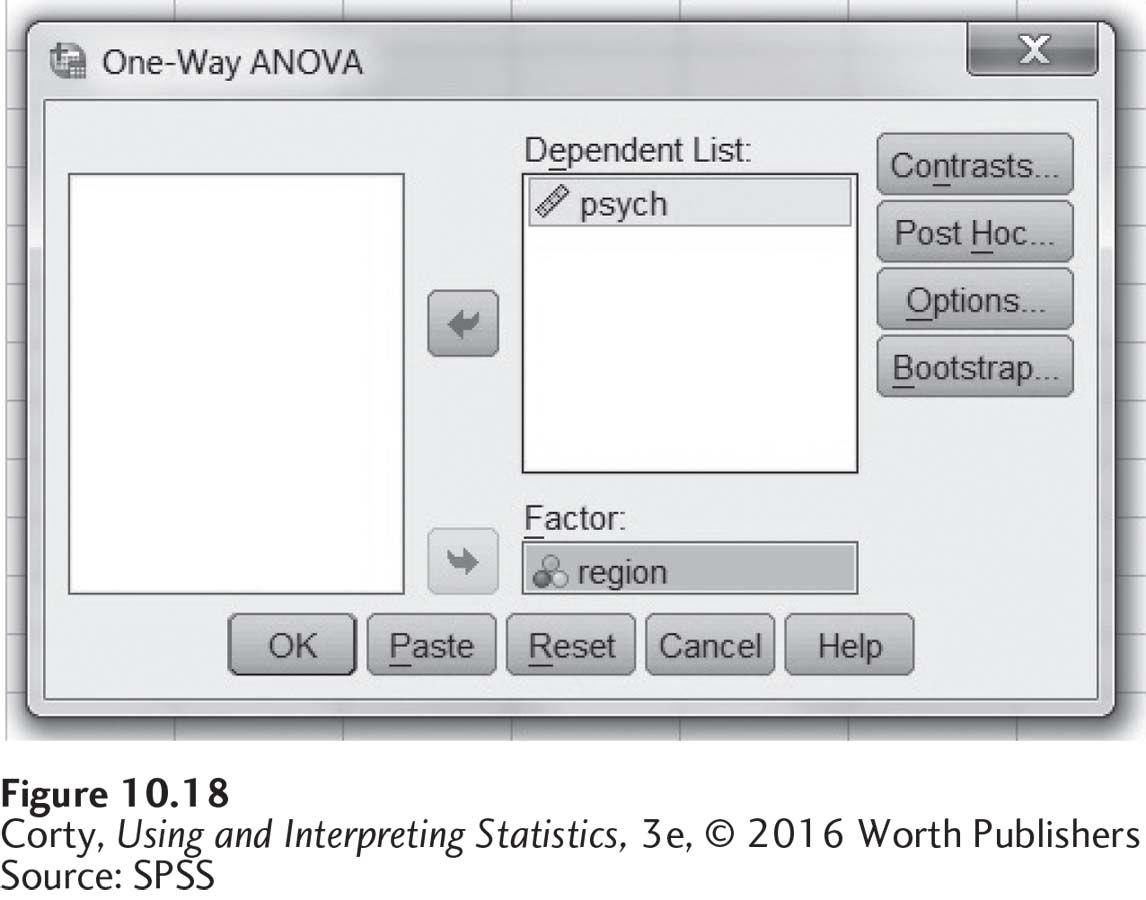
Clicking on “One-Way ANOVA. . .” opens up the commands shown in Figure 10.18. “psych,” the dependent variable, has already been moved over to the box labeled “Dependent List.” “region,” the explanatory variable, is moved over to the box labeled “Factor.”
377
378
Clicking on “OK” produces the output shown in Figure 10.19. Note that SPSS produces an ANOVA summary table like the one in Table 10.14. The SPSS summary table has an extra column on the right, labeled “Sig.” This column reports the exact significance level for the F ratio. If the value reported in the “Sig.” column is less than or equal to .05, then the results are statistically significant and the results are written in APA format as p < .05. If the “Sig.” level is greater than .05, then one has failed to reject the null hypothesis and the results are written in APA format as p > .05.
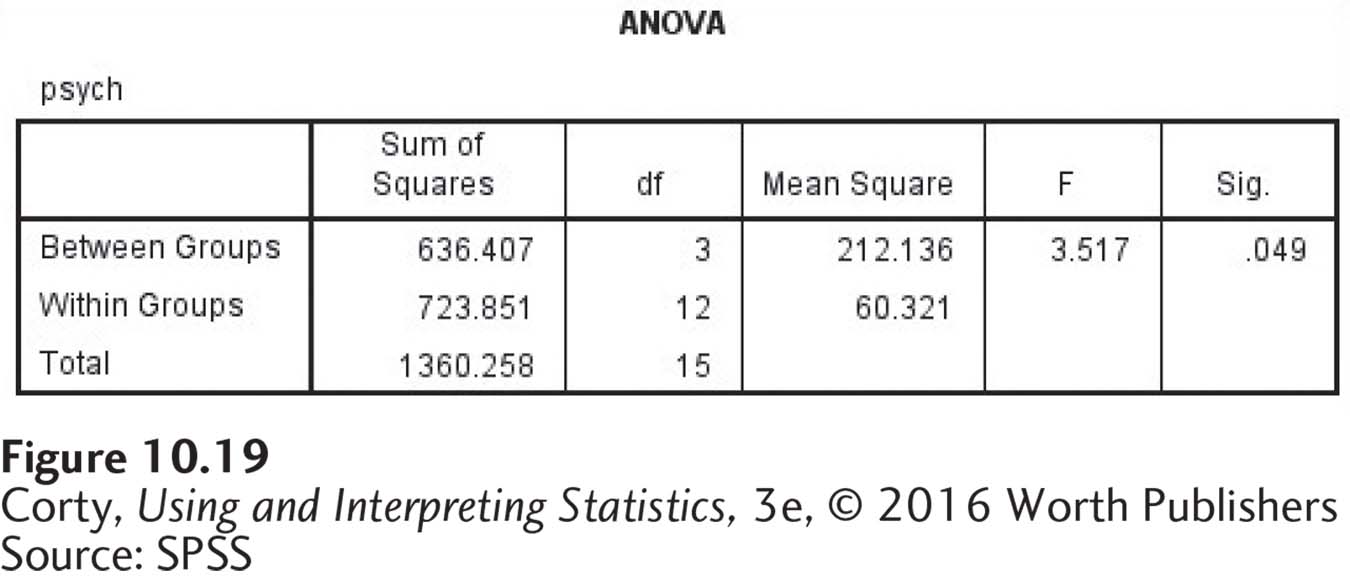
Here, the exact significance level is .049, which is less than .05, so the null hypothesis is rejected. If the exact significance level is known, as it is here, then it should be reported in APA format. These results would be reported as F(3, 12) = 3.52, p = .049.
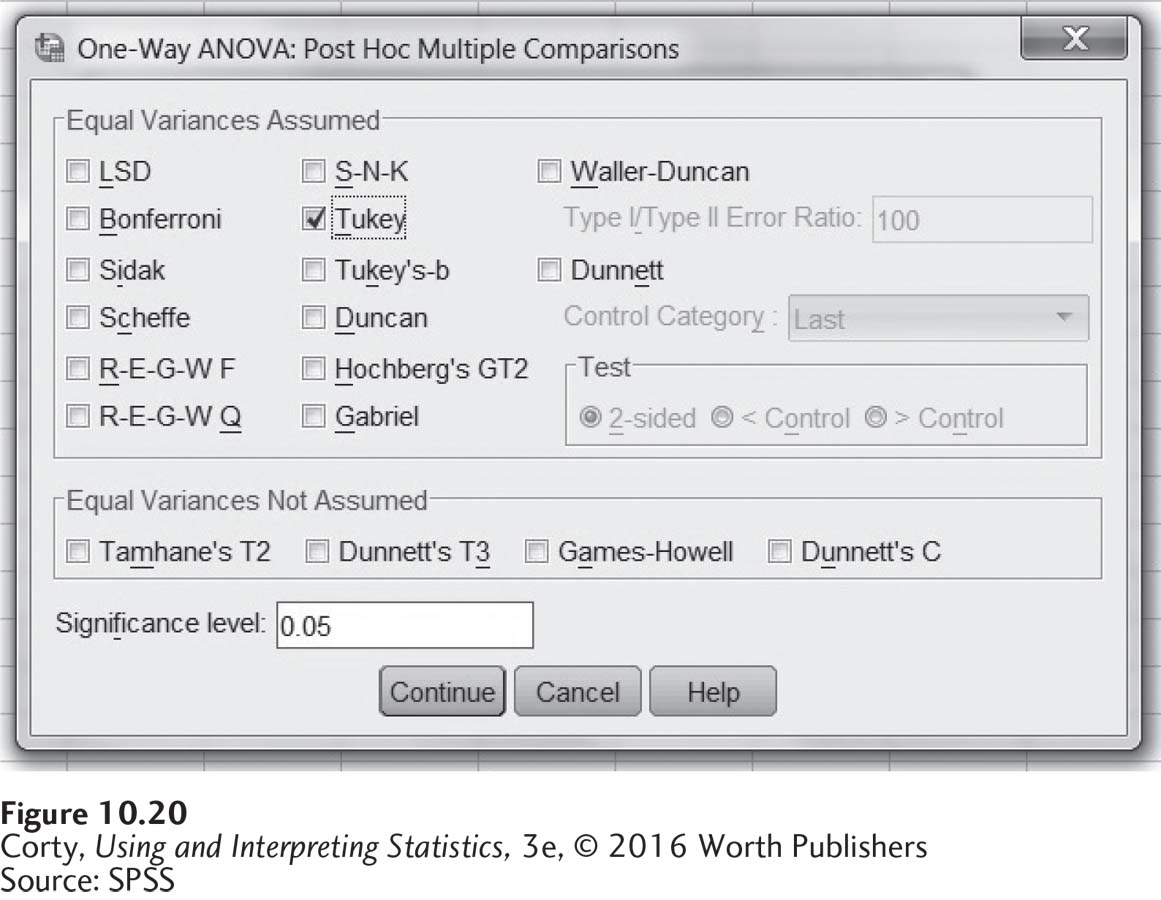
Once a researcher knows that the F ratio was statistically significant, he or she can proceed to select a post-hoc test by clicking the “Post Hoc” button seen in Figure 10.17. This opens up the selection of post-hoc tests seen in Figure 10.20. “Tukey,” which is the Tukey HSD test covered in this chapter, has been selected. If a researcher wants to change the significance level from .05, now is the time to do so.
379
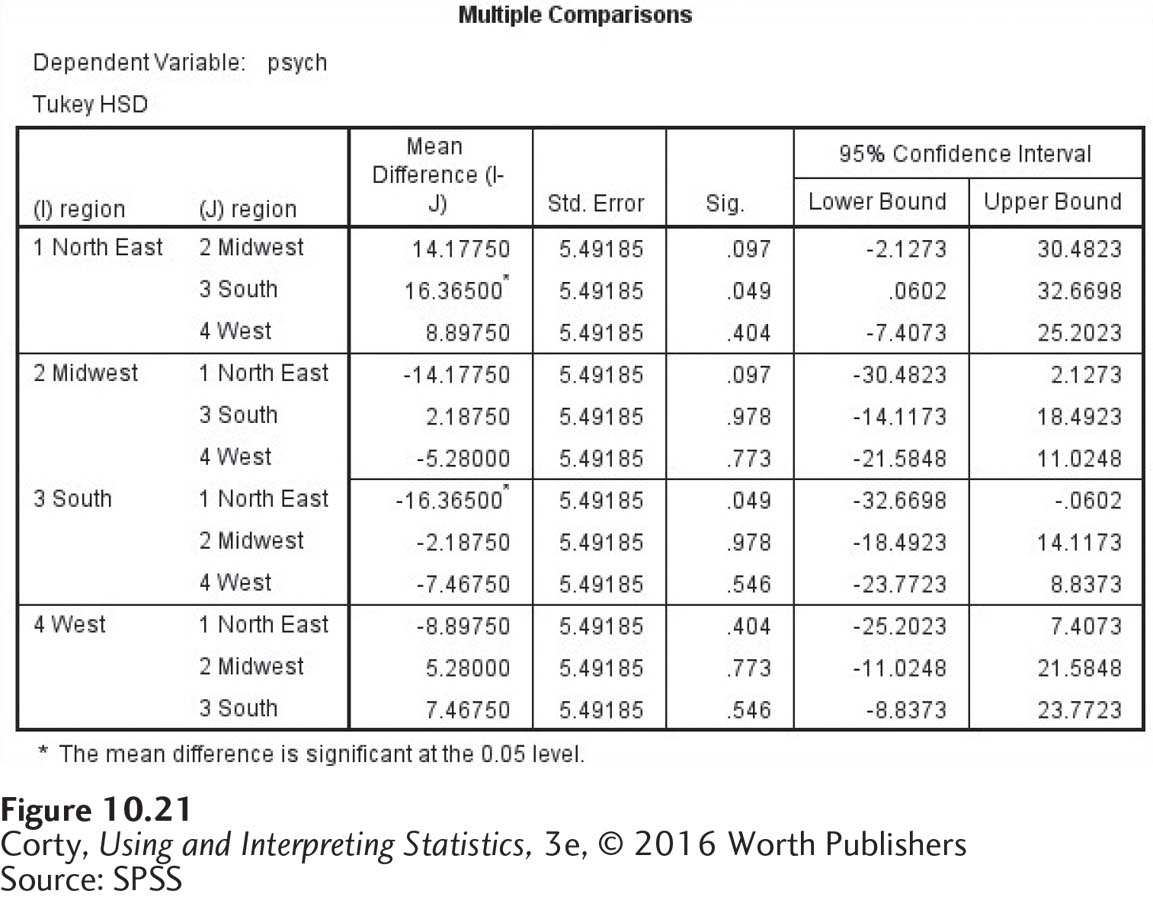
The output from the HSD test is shown in Figure 10.21. SPSS is redundant and has 12 rows in the table when it only needs 6. The first row, for example, compares the Northeast region to the Midwest region, and the fourth row turns this around to compare the Midwest region to the Northeast region. It is exactly the same comparison, though one finds a mean difference of 14.17750 and the other −14.17750. SPSS doesn’t report the HSD values, but it does report each mean difference that is statistically significant at the .05 level. It does this, as mentioned in the table footnote, by placing an asterisk after each mean difference that is statistically significant.
380