CHAPTER EXERCISES
Answers to the odd-numbered exercises appear in Appendix B.
Review Your Knowledge
16.01 Descriptive statistics ____ a set of observations.
16.02 To determine if one group differs from another, the type of test to use is a ____ test.
16.03 Relationship tests are used to see if ____ vary together systematically.
16.04 If cases are divided into groups, the researcher is probably conducting a ____ test.
16.05 The ____ is thought of as the causal agent.
16.06 The two characteristics of a data set most commonly described are ____ and ____.
16.07 Scores are transformed in order to put them into ____.
16.08 In order to choose the correct ____ to display a variable’s frequency, it matters if the variable is discrete or continuous.
16.09 The ____ of the distribution of the data, as well as the variable’s ____, determines what measure of central tendency should be chosen.
635
16.10 This book covered no measures of variability for ____ or ____ variables.
16.11 Level of measurement is / is not important in deciding what difference test to use.
16.12 Two variables are measured on each case in one sample of cases. This sounds like a ____ test is being planned.
Apply Your Knowledge
Determining the type of study
For Exercises 16.13–16.20, determine if the study is descriptive, experimental, quasi-experimental, or correlational.
16.13 A restaurant chain surveys its customers to learn demographic characteristics such as age in years, marital status, and annual income.
16.14 A developmental psychologist has a teacher rate the boys in his class in terms of how helpful they are. He then classifies the boys as to whether they were ever Boy Scouts or not, and compares the helpfulness of the two groups.
16.15 A clinical psychologist obtained a large sample of adults. Each adult kept track of all the food and beverages he or she consumed for a week. From this, the psychologist calculated the average grams of caffeine consumed per day. The psychologist believed that caffeine, a stimulant, might be used to self-medicate for symptoms of ADHD. So, she also had all participants complete an ADHD symptom inventory. She wanted to see if people with more ADHD symptoms consumed more caffeine.
16.16 An economist wondered if job satisfaction was associated with salary. She obtained a sample of first-year teachers from all around the country and found each one’s salary, adjusted for the local cost of living. She also had the teachers complete a job satisfaction survey.
16.17 A cognitive psychologist wondered if the type of computer one used affected how one thought. She put together a sample of kids, randomly divided them into two groups, and gave Apple Macs to one group and Windows PCs to the other group. A year later, she administered the Smith & Jones Measure of Creative and Divergent Thinking to each child.
16.18 A real estate company wondered why some of its agents were more successful than others. The company classified its agents as high-volume producers, medium-volume producers, and low-volume producers. All agents took a personality test and the company compared the three groups on the personality traits measured.
16.19 A milk-processing plant had strict standards regarding how much milk went into each container. A quart container, for example, was supposed to contain no less than 31.5 ounces and no more than 32.5 ounces. Every day, quality control randomly sampled 100 quart containers, precisely measured their contents, and prepared a graph showing the distribution of amount per container.
16.20 A researcher on superstition decided to investigate if walking under a ladder really brought about bad luck. He took 100 people to his laboratory, one at a time. As each person entered, he flipped a coin. If it turned up heads, he had the person walk under a ladder; tails, the person walked next to the ladder. A week later, all the participants returned and reported if anything unlucky had happened to them during the week.
Determining a variable’s level of measurement
For Exercises 16.21–16.26, determine (a) whether the variable is measured at the nominal, ordinal, interval, or ratio level, and (b) whether it is continuous or discrete.
16.21 Ounces of milk, as measured in Exercise 16.19
16.22 Whether anything unlucky or not happened, as measured in Exercise 16.20
16.23 Marital status
16.24 Level of anxiety before a test, as measured 0–4 on a scale marked 0 = none, 1 = slight, 2 = moderate, 3 = considerable, and 4 = extreme
16.25 Heights of randomly selected pieces of land as measured by meters above or below sea level
16.26 Number of light bulbs in a house
636
Selecting the right descriptive statistic
For Exercises 16.27–16.30, select the appropriate statistical technique from among the options in Figure 16.2.
16.27 A measure of variability in IQ scores for students in law school
16.28 The most common marital status among 50-year-old men living in Rhode Island
16.29 A graph showing the number of high-, medium-, and low-volume producers from the real estate company in Exercise 16.18
16.30 The average salary for a sample of first-year teachers in the United States
Selecting the correct difference test
For Exercises 16.31–16.38, select the appropriate statistical technique from among those in Figure 16.5.
16.31 10% of the U.S. population is left-handed. Several recent presidents (Barack Obama, Bill Clinton, George H. W. Bush) have been left-handed. This caused a cognitive psychologist to wonder if presidents were representative of the U.S. population in terms of handedness. What test should she use?
16.32 A demographer was curious if an age difference existed between men and women who were getting married for the first time. From wedding announcements in local papers throughout the United States, he randomly sampled 250 couples for whom it was the first marriage for both the bride and the groom. From the announcements, he obtained their ages. What statistical test should he use to compare the ages of husbands and wives?
16.33 In some educational programs, there are a lot of options. One nursing program, for example, allows its students to decide between (a) traditional, semester-long courses; (b) online courses; (c) weekend-only courses; or (d) courses that meet for 8 hours a day, 6 days in a row. The dean of the school wanted to find out if the type of course content had any impact on how much was learned. At the end of its programs, she administered a 50-question, multiple-choice test about basic nursing facts. What test should she use to see if the groups differ on the mean percentage of questions answered correctly?
16.34 Students often gain a few pounds when they move away to college and start eating institutional food. A nutritionist weighed first-year students at the start of the semester, right before Thanksgiving, on their return to school in January, and at the end of the second semester. What statistical test should he use to see if their mean weight changes over time?
16.35 An ecologist obtained a random sample of 85 small rural towns and a random sample of 72 small suburban towns. For each town, he calculated pounds of trash per resident per year that went to the landfill. What statistical test should he use to see if rural and suburban residents differ in the average amount of trash they generate every year?
16.36 A dentist wanted to examine if milk consumption as a child had an impact on the need for dentures by age 50. He classified his patients as having consumed a lot of milk as a child (yes vs. no) and as to whether they wore dentures by age 50 (yes vs. no). What statistical test should he use to determine this?
16.37 The same dentist wanted to find out if his practice was unusual in terms of how many cavities his patients had. He learned that the average American has 11.23 decayed, filled, or missing permanent teeth. In his dental practice, the mean was 8.76, with a standard deviation of 3.42. What statistical test should he use?
16.38 A textbook publisher calculated the percentage of deadlines met by each of its authors. It then classified the authors as having made money for the company, broken even, or lost money for the company. What statistical test should the company use to see if the three types of authors differ in the degree to which they met their deadlines.
637
Selecting the right relationship test
For Exercises 16.39–16.42, select the appropriate statistical technique from among those in Figure 16.6.
16.39 The dentist from Exercises 16.36 and 16.37 has a new question to contemplate. He wondered if people get most of their cavities when they are young or if they occur consistently over time. To investigate this, he decided to examine the relationship between the ages of his patients and how many of their permanent teeth were decayed, filled, or missing. What test should he use?
16.40 An anti-doping agency decided to investigate if an athlete’s eliteness was related to the likelihood of doping. It unexpectedly drug-tested the top 10 finishers in all the track and field events at a large meet. From this, it calculated the percentage of first-place finishers who tested positive, the percentage of second-place finishers who tested positive, and so on. The agency then wanted to examine the relationship between the place in which an athlete finished and the likelihood of testing positive. What test should the agency use?
16.41 A member of a bicycle club wondered if a relationship existed between how expensive a person’s bicycle was and how fast that person rode. He found riders with bikes in two categories. One group rode bikes that were classified by a cycling magazine as “decent bikes for not too much money.” The others rode bikes classified as “amazing, but even Bill Gates would think twice about spending this much for a bike.” The club member then asked each person to ride solo on a track and time his or her fastest lap. What test should the club member use to see if there’s a relationship between the cost of the bike and the speed of the rider?
16.42 Some people like cats and some like dogs. Cats are generally thought of as more independent and aloof. A personality psychologist wondered if a relationship existed between the personality trait of introversion/extroversion and the type of pet a person preferred. He obtained a sample of cat owners and a sample of dog owners. Each pet owner took a personality test and was classified as an introvert or an extrovert. What statistical test should be used to see if the two variables are related?
Expand Your Knowledge
In this series of questions, there are no headings that tell which flowchart to use. Plus, some gaps occur in the flowchart. For example, if the scenario has two dependent samples with an ordinal-level dependent variable, there is no such test in the flowchart. Tests exist for such situations; they just weren’t covered in this book. So, if a scenario in this series calls for a “missing” test, just write, “No such test in book” as your answer.
16.43 A neonatologist is curious to find out what the long-term effect of premature birth is on mental development. He goes to a large school district, assembles a sample of sixth graders, and determines each student’s IQ score. From each student’s parents, he finds out if the student was full-term or premature at birth. What statistical test should he complete to figure out if there is a relationship between prematurity and IQ?
16.44 A summer camp director wanted to find out if campers’ degree of homesickness changed over time. She took a sample of them at her camp and at three points in time—the beginning, middle, and end of camp—administered the interval-level Homesickness Inventory. What statistical test should she choose to analyze her data?
16.45 A high school principal claimed that academic talent was evenly distributed among the social strata at his high school. To test this, he classified the students as jocks, cheerleaders, techies, stoners, band geeks, and so on and compared class rank among the different groups. What statistical test should he use?
16.46 A health-care researcher obtained a sample of respondents from throughout the United States and asked each one to indicate how worried he or she is about the avian flu on an interval-level scale. Before reporting the results for how worried Americans are about avian flu, the researcher wants to make sure the sample may be representative of the United States in terms of geographic distribution, based on the U.S. Census Bureau’s division of the United States into four regions (Northeast, Midwest, South, and West). What statistical test should he use to answer this question?
638
16.47 A medical school dean wondered whether students who did better in her medical school became better physicians. To test this, she gathered a sample of medical students in their final year and determined their GPAs. She also administered to each student the Differential Diagnosis Test (DDT). The DDT presents students with 50 diagnostic dilemmas. Each dilemma is considered equivalent, and scores on the DDT can range from 0 (no questions answered correctly) to 50 (all answered correctly). What statistical test should the dean use to answer her question?
16.48 Graduates of a particular college were classified as having (a) liberal arts degrees or (b) professional degrees. They were also classified as (1) planning to pursue graduate education or (2) not going on for graduate education. When the graduates returned for their 25th reunion, they completed an interval-level, life satisfaction scale. Is life satisfaction influenced by type of degree and/or graduate study? What statistical test will answer this question?
16.49 A sample of students at a college were asked to classify themselves as (1) Asian; (2) Black; (3) Hispanic; (4) Native American; (5) White; or (6) other. Each person was also asked whether his or her family would consider it acceptable (yes or no) if he or she married someone from a different racial category. What statistical test should be used to see if the degree of acceptability differs among racial/ethnic categories?
16.50 The very last question in this book is a challenging one. It is rare that a researcher does a study that involves just one statistical analysis. Usually, there are multiple dependent variables and a branching series of questions and analyses. Here is an example. An infectious disease specialist believes she has developed a vaccine for the common cold. In order to test its efficacy, she designs a study. As a first step, potential participants call in and provide demographic information (age, sex, race) and complete an interval-level measure of general physical health. After this, they learn more about the study, and about 40% of those who originally called decide that they wish to take part in the study.
The actual study is a double-blind study in which the volunteers will be inoculated either with the active vaccine or a placebo. At the end of the first week, each participant completes a side effect checklist, which counts how many side effects each person has experienced.
For the next 12 months, the research team will keep track of each participant and whether he or she contracts a cold. If a participant contracts a cold, the research team will note how many days have elapsed from the vaccine until the cold. In addition, the researchers will assess the severity of the cold in terms of two dimensions: (1) measuring how many days the cold lasts, and (2) having the cold sufferers report how congested they felt on an ordinal scale.
For each scenario below, decide which statistical test or tests should be used to answer the research question. Be aware—many of these questions involve multiple dependent variables and multiple analyses.
The researcher wants to know if those who volunteered for the study differ from those who chose not to volunteer.
The researcher wants to know if her sample of volunteers is demographically similar to the U.S. population.
Did the active vaccine have more side effects than the placebo?
The primary measure of the vaccine’s effectiveness is whether or not people in the experimental group, compared to the control group, did or did not contract a cold during the year after the vaccine. How should she answer this question?
Secondary measures of the vaccine’s effectiveness were, for those who contracted colds, how long the cold lasted and how sick they were. What tests should the researcher do to answer these questions?
639
For the control group participants, the researcher was interested in the relationship between their general physical health and contracting a cold. How can this question be answered?
For the control group participants who contracted a cold, the researcher was interested in the relationship between general physical health and the severity of the cold. How should she answer this question?
SPSS
SPSS, like most serious software programs, has a variety of help options. One help option is Statistics Coach, which leads users through a series of questions to the selection of a statistical test. Let’s see how it works, using as an example the study in which the effect of early parental loss is measured years later in adults. There were four independent samples (no loss, mother died, father died, both died), and the dependent variable was measured at the interval level.
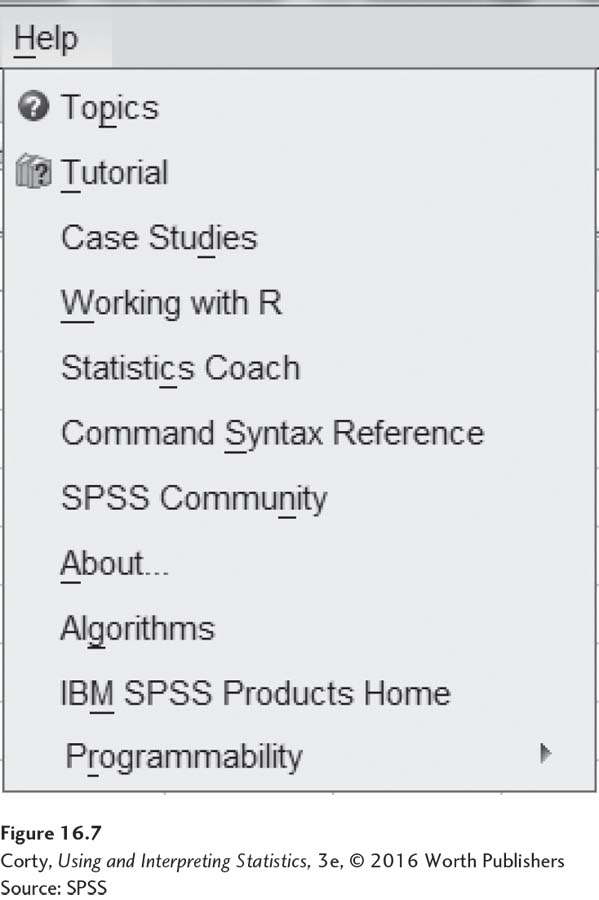
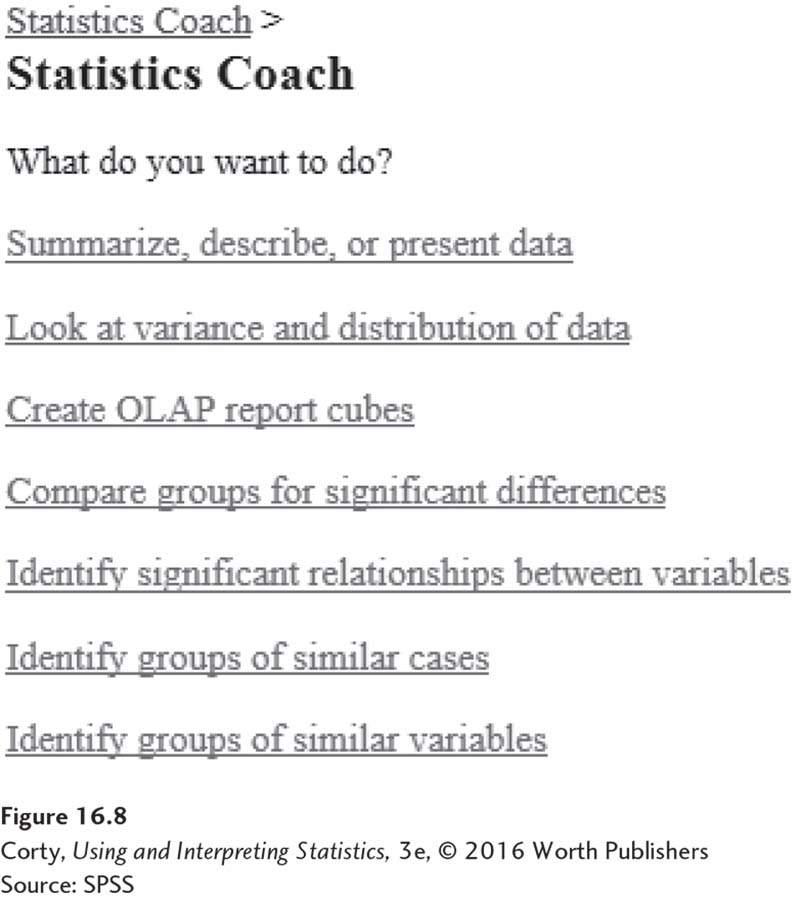
Figure 16.7 shows the help options available within SPSS. Statistics Coach is on the fifth line down. Clicking on it opens up the screen shown in Figure 16.8, where SPSS asks, “What do you want to do?” There are seven possible answers to the question. Option 1 and option 2 involve descriptive statistics, option 4 applies to difference tests, and option 5 relationship tests. The other three options lead to more advanced statistics.
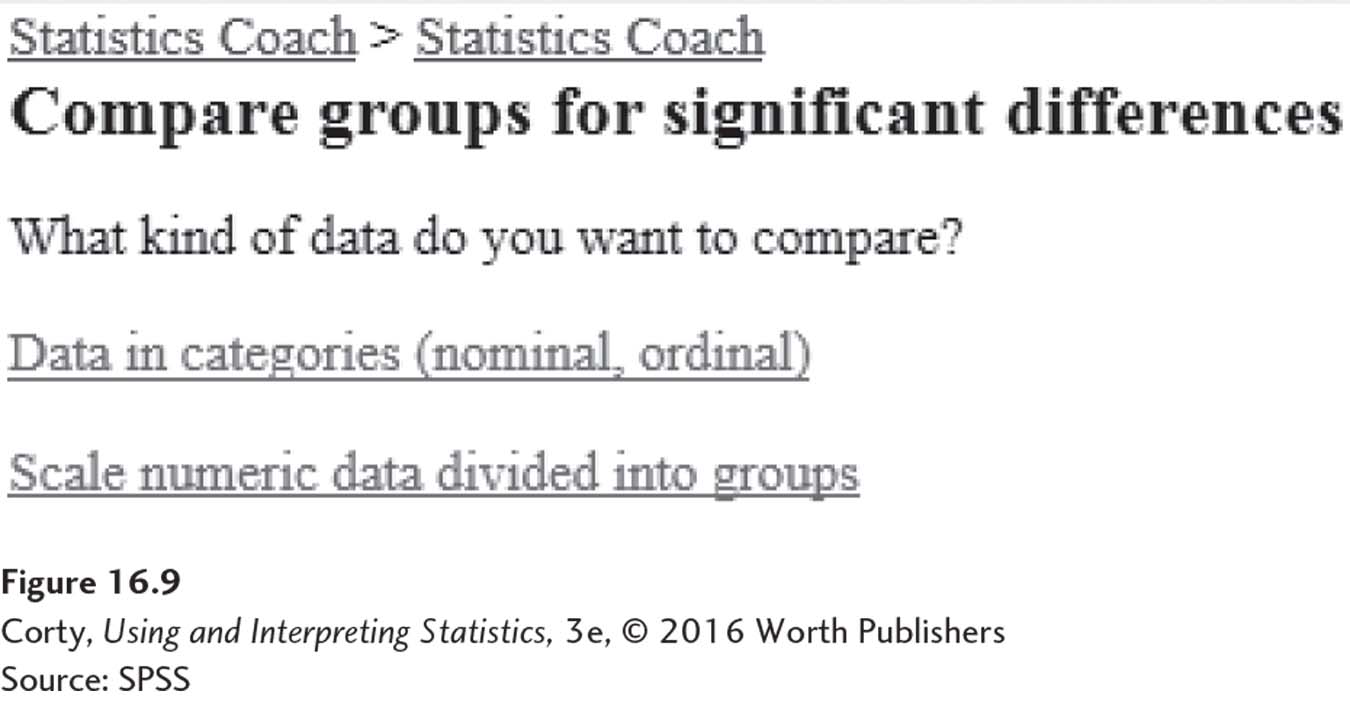
Clicking on the option for difference tests leads to the query, seen in Figure 16.9, about the kind of data. SPSS calls interval and ratio data “scale” data. Here, it is checking how the cases are divided into groups, on the basis of the level of measurement for the variable. Click on the option for “scale numeric data divided into groups.”
640
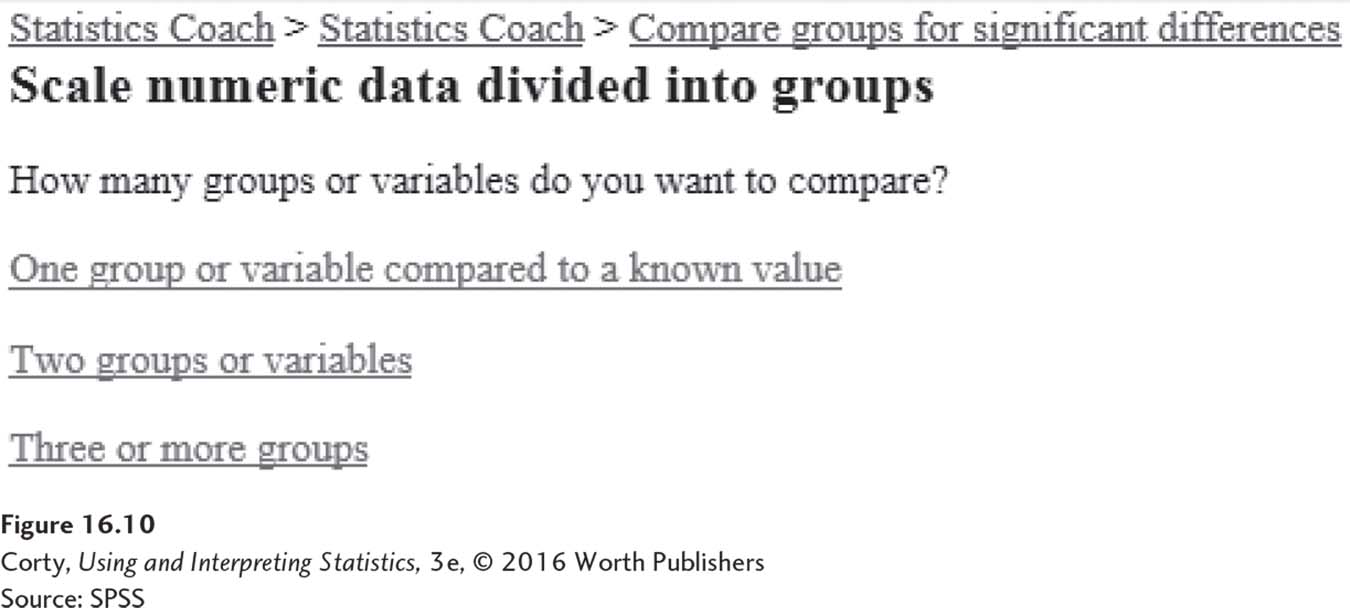
The next question, seen in Figure 16.10, concerns how many groups there are. This study involves three or more groups.
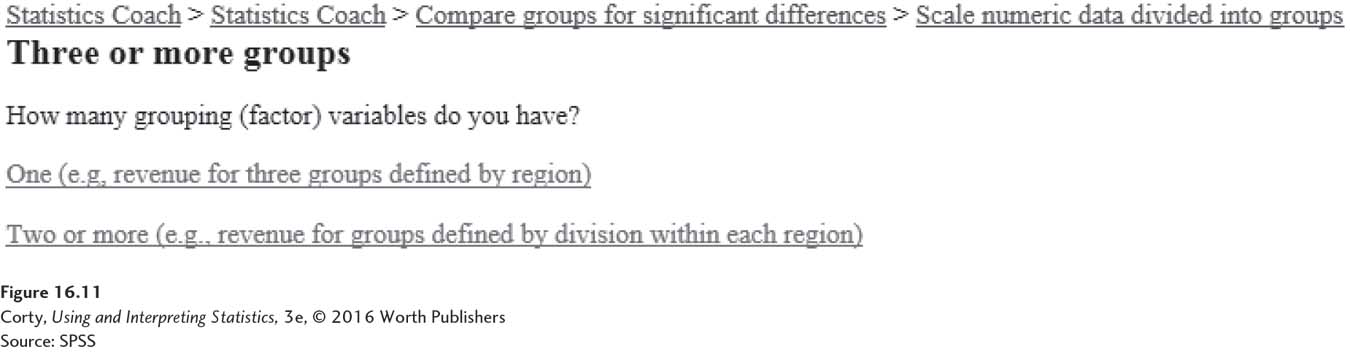
Clicking on three or more groups brings up the next screen, Figure 16.11, which inquires how many “grouping” or “factor” variables exist. These are what the text calls independent variables, and there is only one of them.
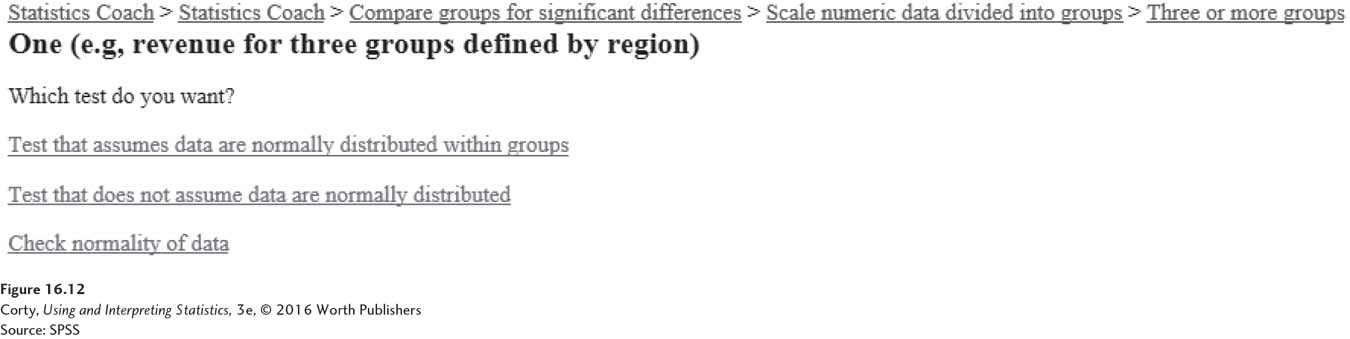
Clicking on one grouping variable brings up the next-to-last screen, Figure 16.12, which asks whether the data are normally distributed (i.e., a parametric test), not normally distributed (i.e., a nonparametric test), or if one wants to check.
641
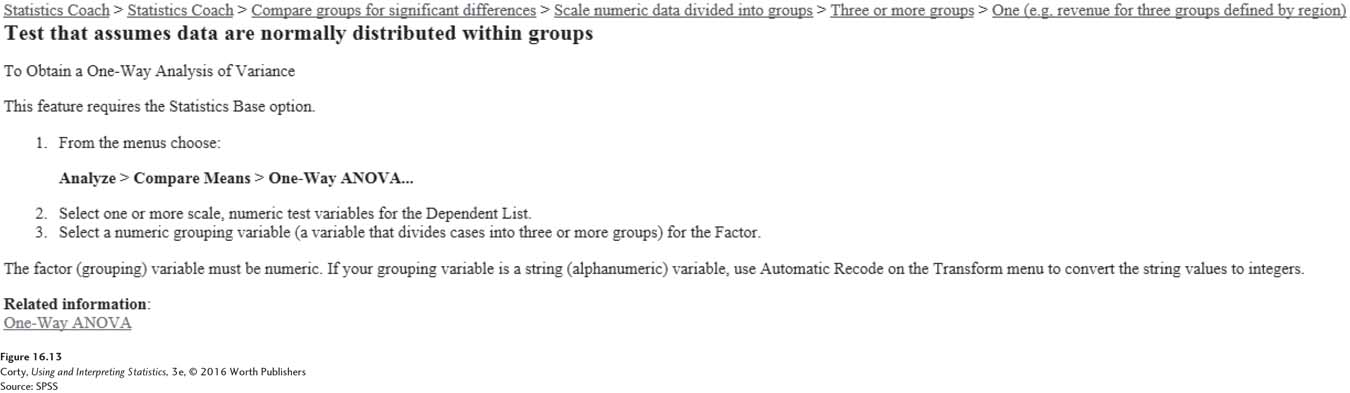
Selecting normally distributed leads to a decision about what test should be done, a one-way ANOVA. As can be seen in Figure 16.13, SPSS also provides information about where the commands are located.