1.2 Experiments and Variables
6
 StatClips: Types of StudiesVideo on LaunchPad
The characteristics measured by researchers are called variables. They are called variables for a simple reason—they vary. Some characteristics commonly measured by psychologists are height, weight, intelligence, aggression, and neurotransmitter levels. In any group of people, there are differences on all these variables—people differ in their heights and weights, some are smarter than others, some exhibit more aggressive behavior, and not everyone has the same levels of neurotransmitters. No matter the variable, different people have different amounts of it or different types of it. Variables vary.
The subjects of a study, the objects on whom these variables are being measured, are called cases. In many psychological studies, cases are people who participate in the study. But psychologists also study other animals like rats, pigeons, monkeys, and even cockroaches—all of which would be called cases. Sometimes the object of study, the case, is smaller than a whole organism, such as nerve cells. And sometimes the cases being studied are larger, like cities or nations. For example, in the binge drinking tables shown earlier, the cases were states.
The most common type of study done by psychologists asks a question about the relationship between two variables. Here are some examples:
7
Is there a relationship between how much violent television children watch and how aggressive they are?
Is there a relationship between how one studies and how much one learns?
Is there a relationship between children’s attachment to their parents and their future mental health?
Is there a relationship between the intensity of a stimulus and whether a neuron fires?
Is there a relationship between sugar consumption and hyperactivity?
Is there a relationship between the population density of cities and their suicide rates?
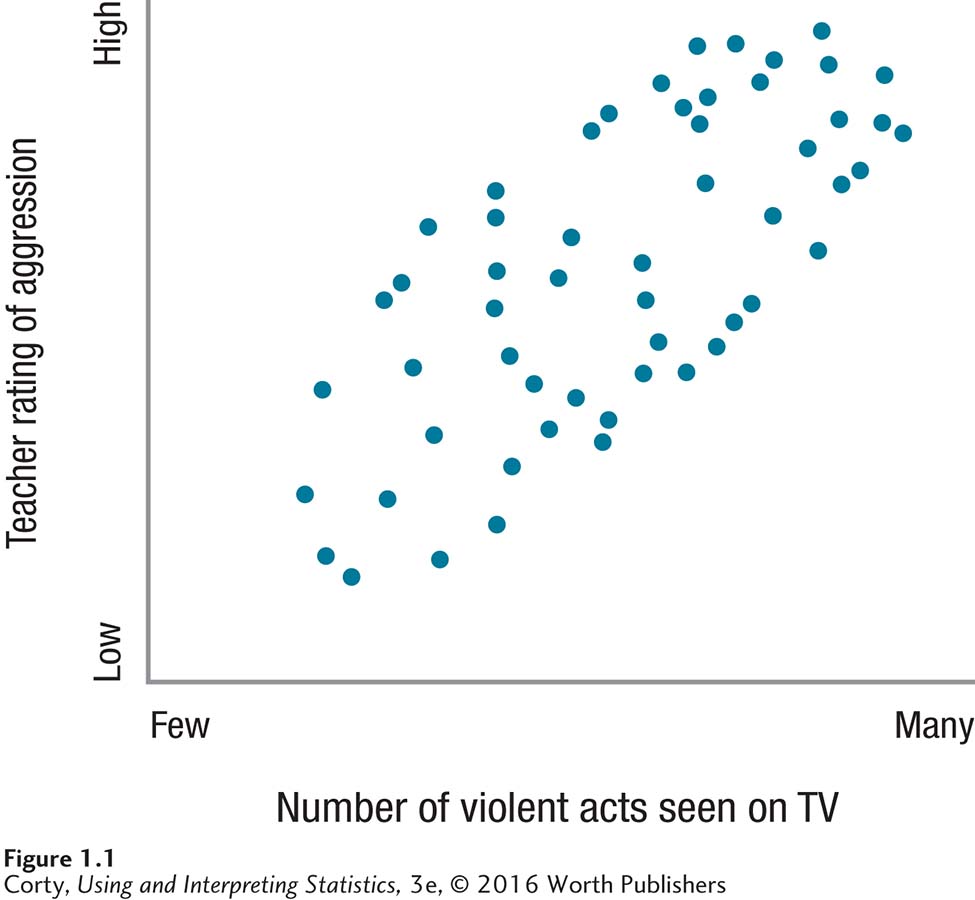
To answer a relationship question, a researcher obtains a sample of cases and measures each case’s level on each of the two variables. If a social psychologist were investigating a possible relationship between the amount of violent television watched and aggression, she would get a group of children and find some way to measure both how much violent TV they watched and how aggressive they were. She might, for example, find out what shows the children watched during a week, find out how many violent acts were in each show, and then total the number of violent acts seen during the week. To measure the children’s aggression, she might have their teachers complete an aggression inventory on them. In doing so, she would have measured two variables—the number of violent acts seen on television each week, and aggression level as rated by teachers—and could now look for a relationship between them.
Correlational Designs
There is a formal name for the type of study that asks a relationship question—a correlational design. In a correlational design, the two variables are simply measured, or observed, as they naturally occur. The two variables are not controlled or manipulated by the experimenter. In the TV and aggression study outlined above, for example, the researcher didn’t change or limit the type of TV the kids watched and she didn’t try to control their aggression. She simply took the cases as they were on the two variables.
In a correlational study, the researcher measures the pairs of variables for the cases in the sample and determines if they vary together in a systematic way. If cases have a lot of one variable, do they also tend to have a lot of the other? In the TV and aggression study, imagine that the researcher found that kids who watched more violent TV were rated as more aggressive by their teachers. This relationship is shown in Figure 1.1. If this researcher thinks that watching violent TV has an influence on aggressive behavior, she would call the amount of violent TV watched the predictor variable and the rating of aggression the criterion variable. The predictor variable is the one that comes first chronologically or that is believed to drive the relationship. The criterion variable is the outcome variable; it is where the influence of the predictor variable is observed.
A correlational design allows researchers to study relationships between variables as they exist in real life—and that’s a big advantage.
A correlational design allows researchers to study relationships between variables as they exist in real life—and that’s a big advantage. But, there is a substantial disadvantage to correlational designs as well: correlational designs don’t allow a researcher to draw a conclusion about cause and effect, about whether one variable causes the other.
8
Statisticians and college professors love to go around saying, “Correlation is not causation.” Here’s why that’s true. Think about the relationship shown between watching violent TV and being aggressive in Figure 1.1. It makes sense that seeing violence modeled on TV leads one to imitate it and behave aggressively. So, it is tempting to conclude this study means that TV violence causes aggression. However, one can’t reach such a conclusion with certainty. If two variables (let’s call them X and Y) are correlated, three possible explanations exist. However, the correlation doesn’t reveal which of the explanations is the right one.
Does X cause Y?
Or, does Y cause X?
Or, does a third variable cause both X and Y?
Using the labels X and Y, one can label the amount of violent TV watched as X and the amount of aggressive behavior as Y. The X causes Y explanation for the relationship would be that watching violent TV causes children to behave aggressively. As discussed above, this is a plausible explanation. But, isn’t the Y causes X explanation just as plausible? Doesn’t it make sense that kids who are more aggressive, who like to hit and hurt other kids, would be drawn to watch TV shows that mimic their behavior? Looking at Figure 1.1, couldn’t one conclude that being aggressive leads to choosing to watch more violent TV? A correlation only tells that two variables are related. A correlation doesn’t tell anything about the direction of the relationship.
There’s one more possible explanation for a relationship between X and Y, that a third variable causes both X and Y. This type of third variable has a formal name: confounding variable. In a correlational design, a confounding variable has an impact on both variables (on X and on Y) and is the reason why the two variables covary. If there is a confounding variable, X doesn’t cause Y and Y doesn’t cause X; the confounding variable causes both.
This can be confusing, so here’s an example to help clarify. There are parents who control their children—they limit what type of TV their kids watch, they restrict consumption of junk food, make sure homework is done before playtime, make sure their children are well-mannered, and so on. Wouldn’t the children of these parents watch very little violent TV? Wouldn’t these children also be more likely to be rated as less aggressive by teachers? If it were found that watching violent TV covaried with aggressiveness, couldn’t this be explained by the confounding variable of parenting style? That is, parenting style causes both the amount of violent TV watched and aggressive behavior.
9
There can be more than one confounding variable in a correlational study. Sex, whether one is a male or a female, could be another confounding variable for the TV and aggression study. Who will, in general, be rated as more aggressive by teachers, boys or girls? Probably boys. What if boys also tend to watch more violent television? Then, the observed relationship between watching violent TV and being aggressive could be explained by the confounding variable of sex.
A Common Question
Q Can a confounding variable affect just one of the variables?
A No, a researcher has to make a case that the confounding variable has an impact on both X and Y.
Experimental Designs
Not being able to draw cause-and-effect conclusions is a significant limitation of correlational designs. Luckily, there’s another type of study, called an experimental design, that allows researchers to draw cause-and-effect conclusions. In an experimental design, one of the variables, called the independent variable, is manipulated or controlled by the experimenter. The effect of this manipulation is measured on the other variable, the dependent variable. This sounds more complex than it is, so an example should help clarify.
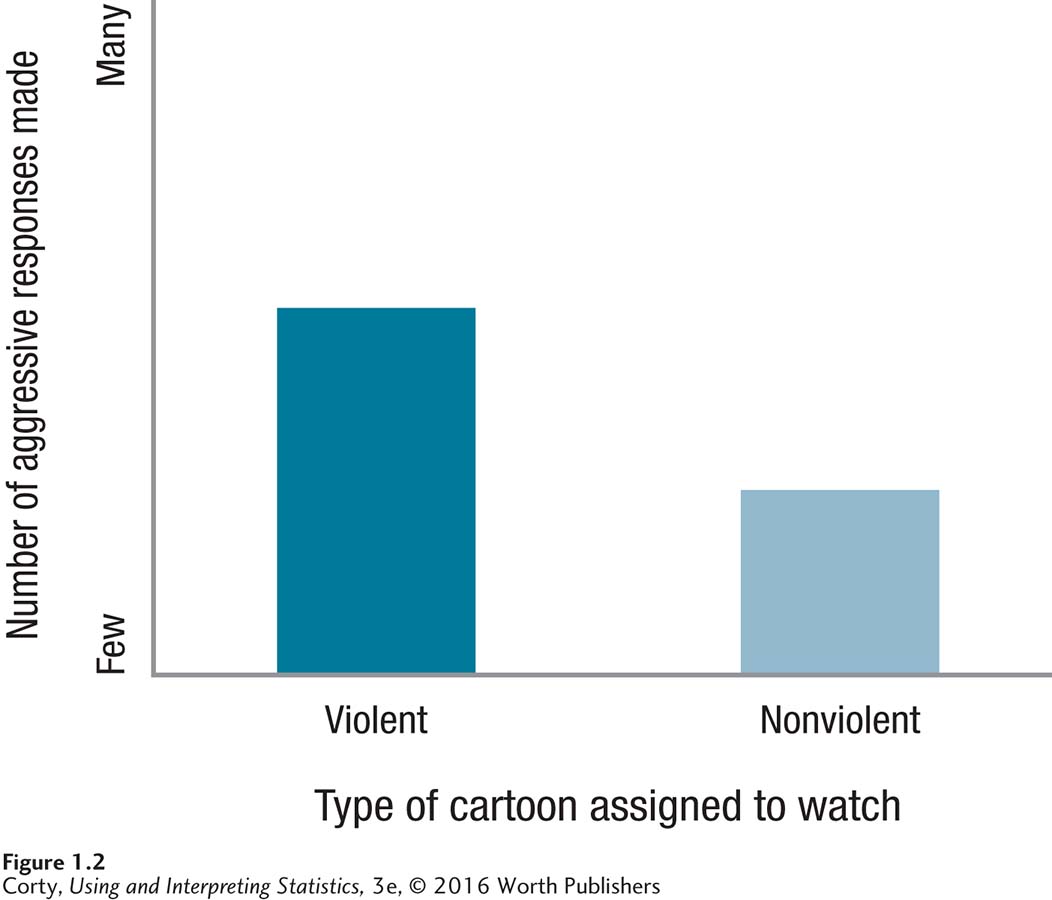
Let’s make the TV and aggression study into an experimental design. Suppose a different researcher obtained a group of kids, brought them into his laboratory, and separated them into two groups by flipping a coin for each kid. He called one group the “control” group and the other the “experimental” group. If the coin turned up heads, he assigned the kid to the control group and showed a nonviolent cartoon. If the coin turned up tails, he assigned the kid to the experimental group and showed a violent cartoon. Note that the researcher is controlling what type of cartoon, violent or nonviolent, each kid watches. This, the independent variable, is the only difference between the control group and the experimental group. Thus, the control group provides a comparison group for an examination of the effect of a violent cartoon.
After watching the cartoon, the researcher has each kid play a video game that involves making choices between a cooperative response or an aggressive one. He keeps track of the number of aggressive responses each child makes as the dependent variable.
The researcher completes the study by comparing the average number of aggressive responses in the group of kids who watched the violent cartoon to the average number in the group of kids who watched the nonviolent cartoon. If he found that watching the violent cartoon increased the number of aggressive responses, then the results might look like they do in Figure 1.2.
Note that this experiment differs from the correlational study because the cases are in groups and the groups are being treated differently. What makes this a “true” experimental design is how the cases are assigned to groups, by random assignment. In random assignment, each case has an equal chance of being assigned to either group. When the researcher flipped a coin to determine which type of cartoon each kid would watch, that was random assignment. Random assignment is the hallmark of an experiment.
10
Why is random assignment so important? Random assignment means that the only difference between the two groups should be the independent variable that is controlled by the researcher.
Why is random assignment so important? Random assignment means that the two groups should be similar on all dimensions before the experiment begins. Thus, after the experiment is over, the only difference between the two groups should be the independent variable that was controlled by the researcher. And, if the only difference between the two groups is the independent variable and the two groups differ on the dependent variable, then the only cause for the observed difference is the independent variable. Confounding variables, which caused a problem with correlational designs, are taken out of contention by random assignment. Because of this, with experimental designs, one can draw a conclusion about cause and effect.
To clarify how this works, think of the TV and aggression experiment in which random assignment was used to assign kids to groups. Remember the two confounding variables mentioned for the correlational design, parenting style and sex? Thanks to random assignment, these are no longer an issue in an experimental design. If a child has controlling parents, he or she has an equal chance of being assigned to either group. As a result, both groups should have roughly equal numbers of children who have controlling parents, which means parenting style can no longer be used as an explanation for the difference found in the number of aggressive responses. Similarly, the two groups should be roughly equal in the percentage of boys. In fact, no matter what the potential confounding variable is, the two groups should be close to equivalent on it.
Here’s the logic of why the independent variable has to be the cause of any observed differences on the dependent variable when we use random assignment:
If the two groups are alike in all ways except the independent variable (e.g., type of cartoon watched),
11
and the two groups are found to differ on the dependent variable (e.g., number of aggressive responses),
then the only plausible explanation for the difference on the dependent variable is the independent variable.
Quasi-Experimental Designs
There’s one more type of study to know about, a mash-up of a correlational design with an experimental design. It looks like an experimental study, but is like a correlational one and is called a quasi-experimental design. In a quasi-experimental design, the cases are classified as being in different groups on the basis of some characteristic they already possess. They are not assigned to groups based on a variable that the researcher controls. In a quasi-experiment, the groups are naturally occurring groups. The naturally occurring groups are then compared on an outcome variable.
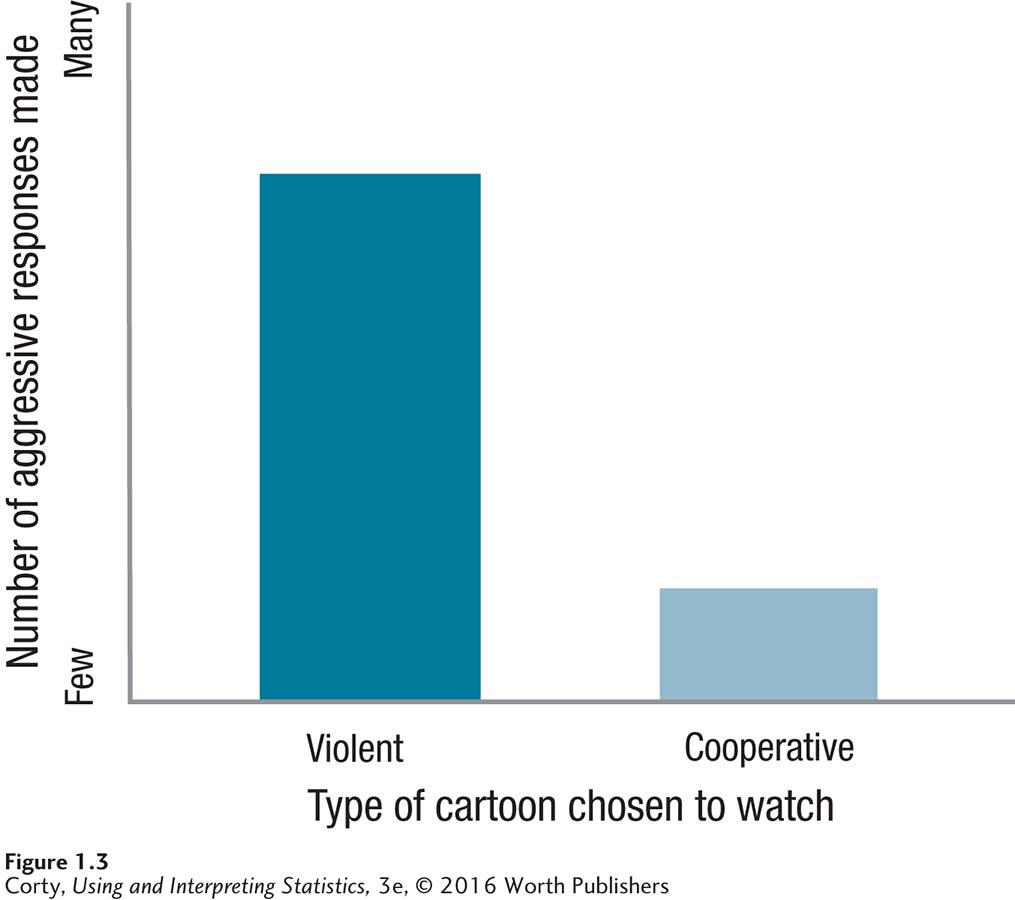
Again, this sounds more complex than it is. To clarify, imagine a third researcher studying the television and aggression example, one using a quasi-experimental design. This researcher starts the same way the researcher did for the experimental design, by bringing kids to her laboratory. But she treats them differently than he did once they get to the lab. She tells them that they can pick a cartoon to watch from two options: (1) a violent cartoon with lots of hitting and fighting, or (2) a nonviolent cartoon with lots of cooperative acts. After each kid has watched his or her cartoon choice, she has him or her play the video game and records how many aggressive responses were made. This looks like the experimental design because she is comparing two groups. However, she is not controlling any of the variables, so it is actually similar to a correlational design.
The results might turn out as shown in Figure 1.3, indicating that those who watched the violent cartoon engaged in more aggressive behavior. These results might tempt the researcher to draw a cause-and-effect conclusion—that watching violent TV leads to aggressive behavior—but a researcher can’t draw a cause-and-effect conclusion for a quasi-experimental design. Because a quasi-experimental design doesn’t utilize random assignment, confounding variables could exist. For instance, maybe the cooperative cartoon group has more children of controlling parents or maybe it has more girls. These would be confounding variables that could be the real cause of the results.
12
In quasi-experimental designs, the variable that defines the group in which a participant belongs is called the grouping variable. The variable where the influence of the grouping variable is measured is called the dependent variable, exactly the same name used in experimental designs. In the case above, cartoon choice is the grouping variable and number of aggressive responses is the dependent variable.
Why would a researcher ever use a correlational design or a quasi-experimental design if they don’t allow one to draw a conclusion about cause and effect? Correlational designs and quasi-experimental designs allow researchers to study things that, for ethical or practical reasons, can’t be manipulated. If one wanted to know the impact of prenatal maternal cigarette smoking on children’s intellectual development, it wouldn’t be possible to take pregnant women and randomly assign some to smoke cigarettes and others not to smoke. One could, however, do a quasi-experiment in which women were classified as having smoked or not while they were pregnant and the intelligence of their kids was assessed.
Explanatory and Outcome Variables
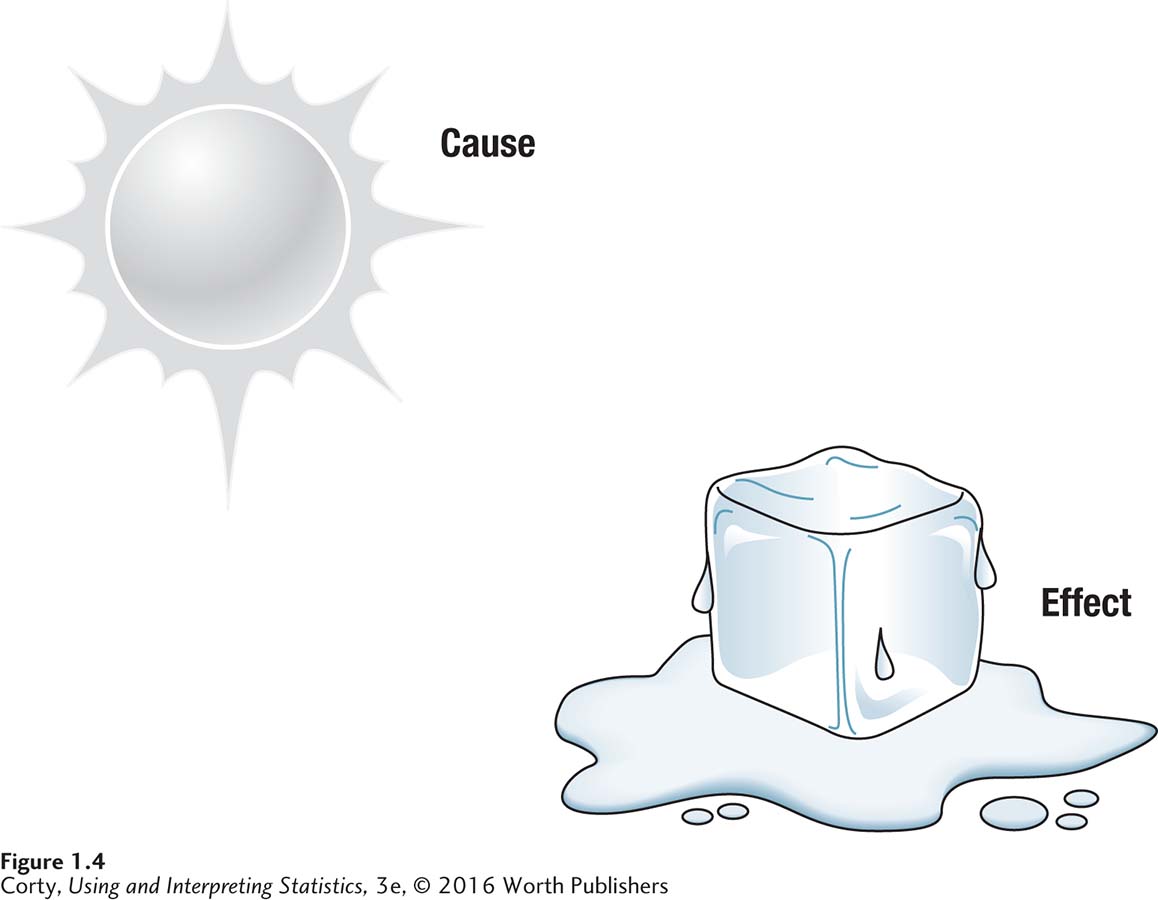
The term independent variable has a specific meaning: the independent variable is the variable in an experimental study that is controlled by the experimenter and has an effect on the dependent variable. To help remember the difference between independent variable and dependent variable, here’s a mnemonic: iced (see Figure 1.4). Iced stands for “independent = cause; effect = dependent.”
A variable is only an independent variable if it is controlled by the experimenter. However, researchers sometimes use terms casually, generically referring to variables in correlational and quasi-experimental studies as independent and dependent. That can get confusing. In this book, the generic term for the variable that causes, influences, or precedes the other is explanatory variable. Outcome variable is the generic term used here for the variable that is caused, influenced, or comes after the explanatory variable. The explanatory variables for correlational, experimental, and quasi-experimental designs, respectively, are predictor variable, independent variable, and grouping variable. The three outcome variables, respectively, are criterion variable, dependent variable, and dependent variable.
13
Table 1.5 summarizes the three different types of studies. It is important to know what type of study—correlational, experimental, or quasi-experimental—is being conducted in order to choose the correct statistical test.
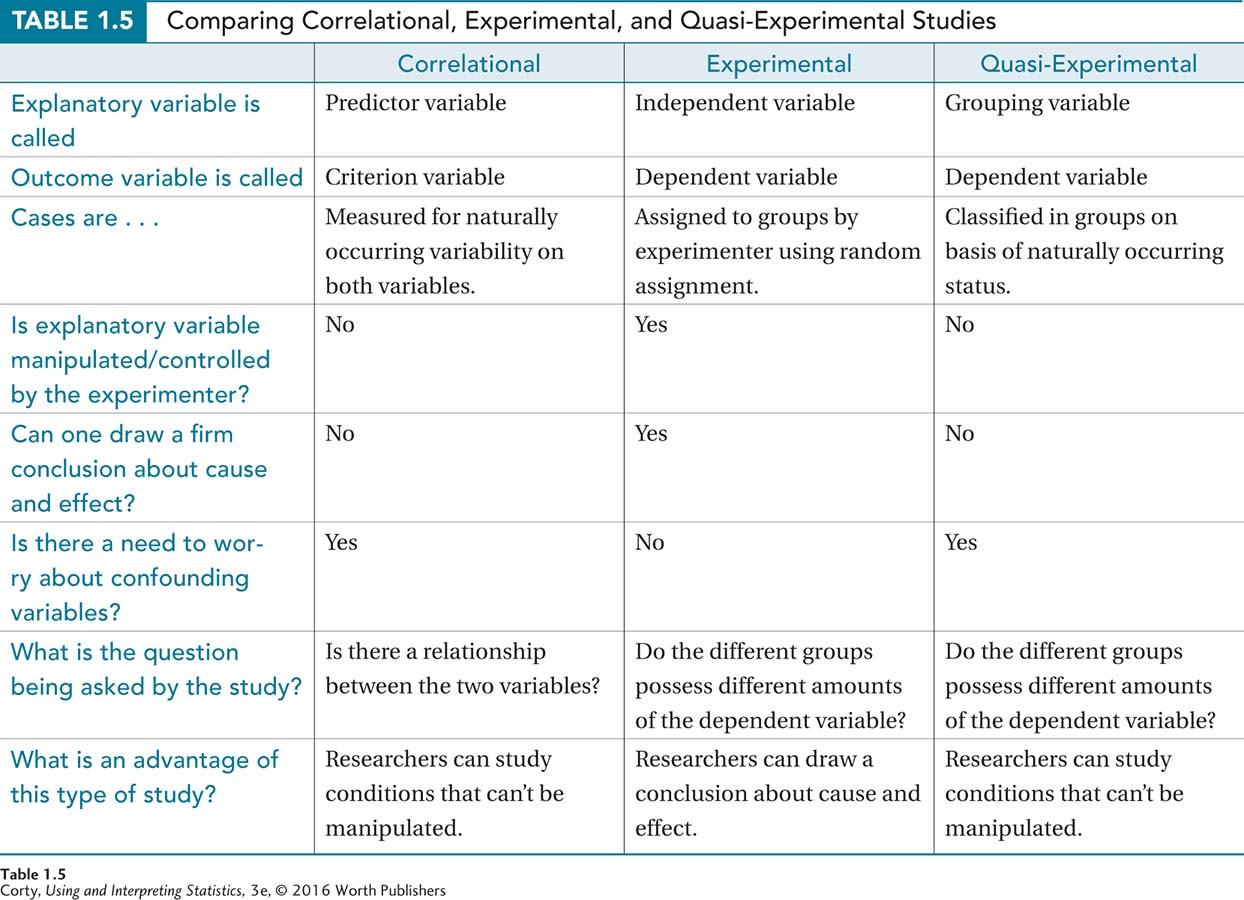
To determine the type of study, one needs to know which variable is the explanatory variable and which variable is the outcome variable. Here are some guidelines to help:
Formulate a cause-and-effect statement (e.g., watching violent TV causes aggression). The “cause” is the explanatory variable and the “effect” is the outcome variable.
Think about chronological order. Does one variable come before the other? The explanatory variable is the one that comes first (e.g., first one watches a lot of violent TV, then one behaves aggressively).
Sometimes it is easier to figure out the outcome variable first, the variable where the “effect” is being measured (e.g., what is being measured is how much aggression kids exhibit). The variable “left over” is the explanatory variable.
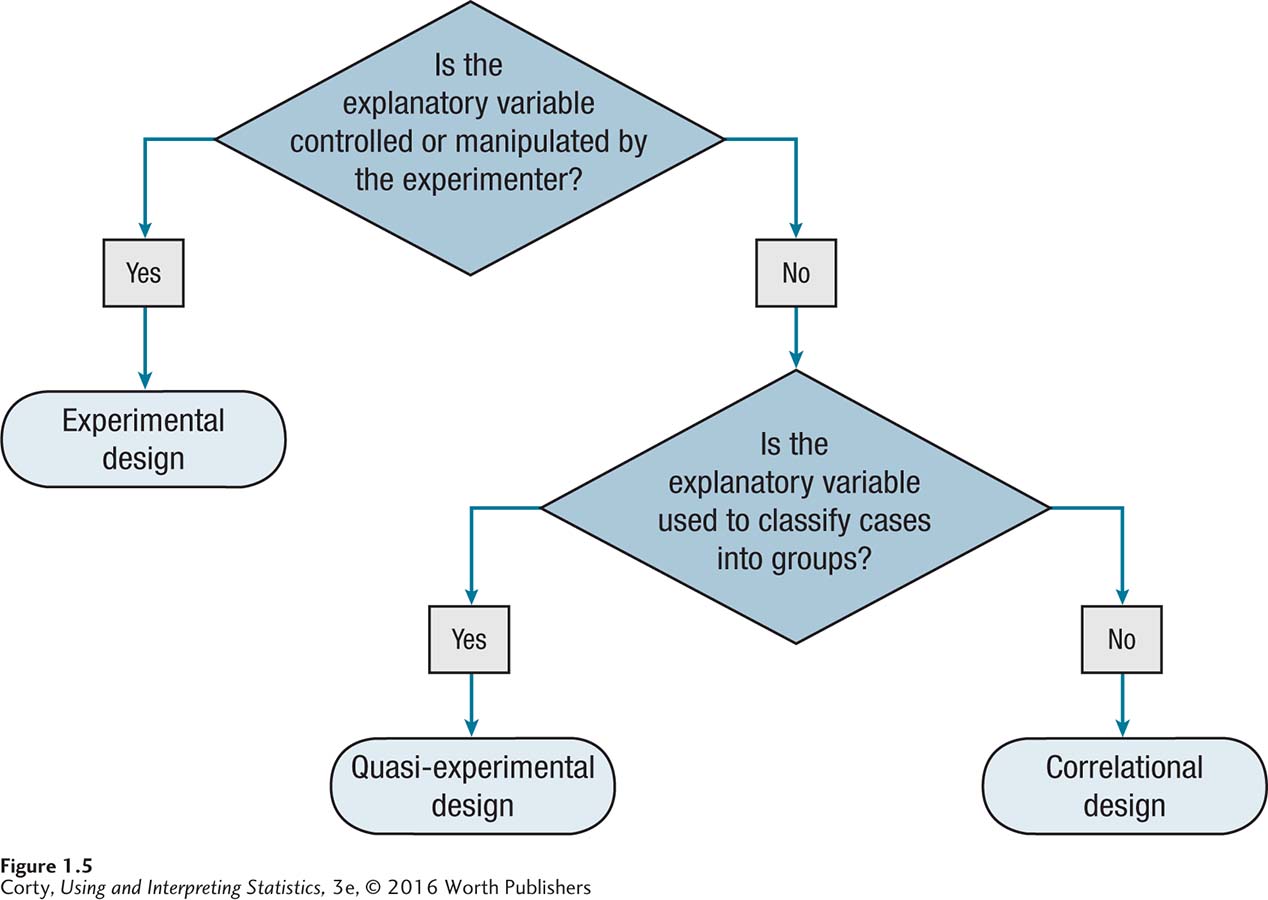
Once it is known which variable is the explanatory variable, use the flowchart in Figure 1.5 to figure out the type of research design. Remember, if the study is correlational or quasi-experimental, consider the possibility of a confounding variable.
14
A Common Question
Q What do the different names for explanatory variables in correlational and quasi-experimental designs signify?
A In a quasi-experimental design, the explanatory variable is called a grouping variable because cases are grouped together. Cases aren’t put into groups for the predictor variable in a correlational design. Rather, typically, cases have a wide range of individual values on both the predictor variable and the criterion variable.
Worked Example 1.1
Let’s practice figuring out (a) which variable is the explanatory variable and which is the outcome variable, and (b) what type of study is being conducted. A health psychologist was interested in studying the effect of life stress on physical health. She administered a life-stress inventory to a group of college students and used their responses to classify them as being high or low on life stress. She also determined how many days in the past year each student had been sick. As shown in Figure 1.6, she found a relationship between the two variables: people in the high life-stress group had more days of illness than those in the low life-stress group.
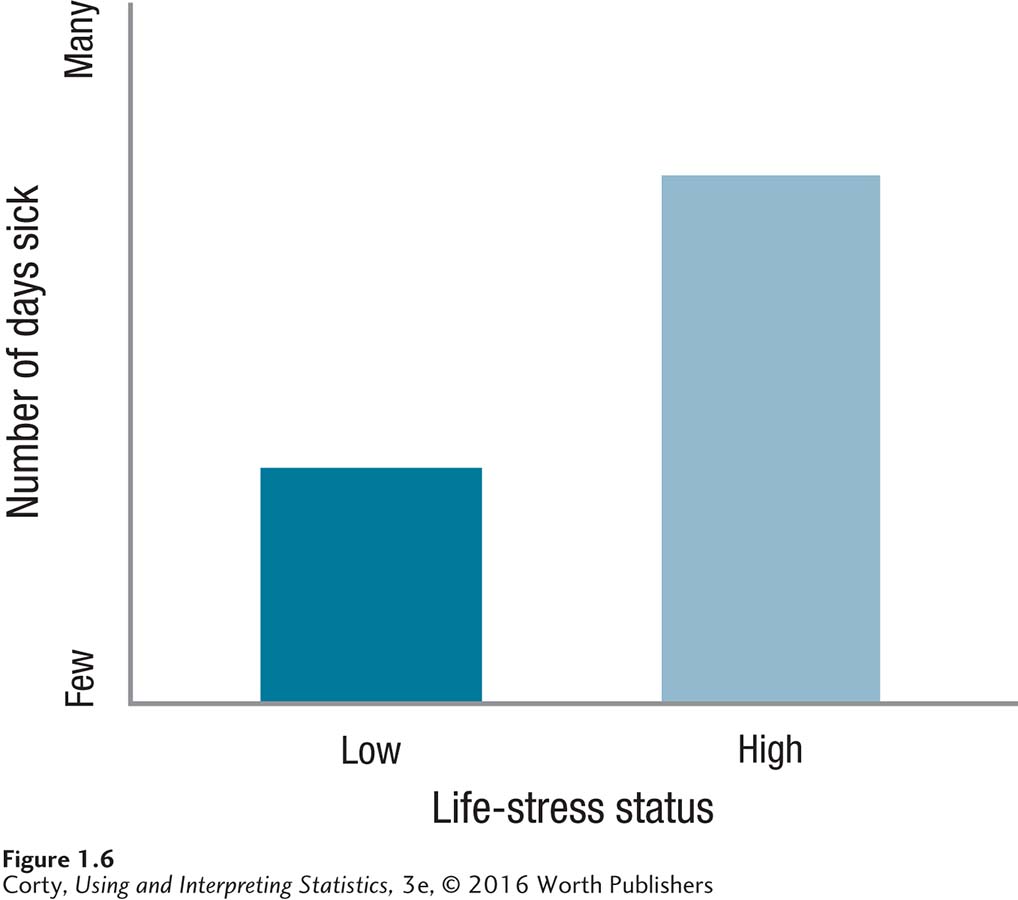
The two variables are life stress (high vs. low) and number of days of illness. The researcher believes that life stress causes/leads to/affects physical health, so the amount of stress is the explanatory variable and the number of sick days is the outcome variable.
15
Using the flowchart in Figure 1.5, one concludes that the study is quasi-experimental because the participants are placed in groups on the basis of how much life stress they naturally have. In quasi-experimental studies, the explanatory variable is called a grouping variable and the outcome variable a dependent variable.
This is a quasi-experimental study, so the possibility of confounding variables exists. What other variables could affect both the grouping variable and the dependent variable in this study? Perhaps people with poor memories recall less stress and are placed in the low-stress group. They might also “forget” how much they were sick last year. These results would seem to suggest that people with more stress experience more illness, but the data really only show that people with better memories recall more stress and recall more illness. Another possible confounding variable is socioeconomic status—people with more money may have less stress and be healthier, as they can afford better medical care. The bottom line: the results show that the amount of stress and the number of sick days covary, but one can’t draw a conclusion about cause and effect from a correlation.
Practice Problems 1.2
Review Your Knowledge
1.03 Name the three different types of studies.
1.04 In which studies are cases assigned to groups?
1.05 In which type of study can one draw a conclusion about cause and effect?
1.06 In which types of studies does one need to worry about confounding variables?
Apply Your Knowledge
For Practice Problems 1.07–1.09:
Write a sentence that states the researcher’s question.
Name the explanatory variable and the outcome variable. Label them as predictor variable and criterion variable, or independent variable and dependent variable, or grouping variable and dependent variable.
16
Determine the type of study: correlational, experimental, or quasi-experimental.
If the study is correlational or quasi-experimental, name a plausible confounding variable and explain how it affects both of the other variables.
1.07 A psychologist gets a group of college students to come to his lab and randomly divides them into two groups. He has each group study a list of nonsense syllables for 15 minutes. One group, the massed group, studies for 15 minutes in a row. The other group, the spaced group, studies for three 5-minute periods, each separated by 10 minutes of a distractor task. Immediately after each group completes the 15 minutes of studying, he measures recall of the nonsense syllables.
1.08 An educational researcher is interested in the effects of sleep on school performance. She classifies students as (a) getting an adequate amount of sleep or (b) not getting an adequate amount of sleep. Then she measures school performance by finding out their GPAs for a semester.
1.09 A nutritionist is examining the role of fiber in gastrointestinal (GI) health. He believes that consuming fiber is good for GI health. He gathers a group of college students and asks each one the number of grams of fiber consumed per day. He also asks each one how many episodes of GI distress (upset stomach, nausea, vomiting, diarrhea, etc.) he or she has experienced in the past year.