CHAPTER EXERCISES
Answers to the odd-numbered exercises appear in Appendix B.
Review Your Knowledge
5.01 A ______ is the larger group of cases a researcher is interested in studying, and a sample is a ______ of these cases.
5.02 A good sample is ______ of the population.
5.03 A representative sample contains all the ______ found in the population in the same ______ as in the population.
5.04 When a sample is representative, we can ______ the results from the sample to the ______.
5.05 A ______ sample is composed of easily obtained cases.
5.06 In a ______, all the cases in the population have an equal chance of being selected.
5.07 A ______ can be used to draw a random sample.
5.08 A representative sample ______ guaranteed if one has a random sample.
5.09 Larger samples provide sample values closer to ______ values.
5.10 If not everyone targeted for inclusion in the sample agrees to participate, ______ may occur.
5.11 Self-selection bias occurs if the people who agree to participate in a study ______ in some way from those who opt not to participate.
5.12 The ______ is the percentage of targeted subjects who agree to participate.
5.13 As long as the consent rate is greater than or equal to ______%, concern with self-selection bias isn’t too great.
5.14 Discrepancies between randomly drawn samples and a population can be explained by ______.
5.15 Sampling error is caused by ______ factors.
170
5.16 Sampling error is thought to be ______ distributed.
5.17 Usually, the amount of error caused by sampling error is ______, but occasionally, it is ______.
5.18 If one takes repeated random samples from a population, calculates some statistic for each sample, and then makes a frequency distribution for that statistic, it is called a ______.
5.19 The standard deviation of the sampling distribution of the mean is called the ______.
5.20 The ______ describes the shape of the sampling distribution of the mean when the size of the samples is ______ and every possible sample is obtained.
5.21 A large sample, as is required for the central limit theorem, has at least ______ cases.
5.22 According to the central limit theorem, the sampling distribution of the mean will be normally distributed, no matter what the ______ of the parent population is.
5.23 According to the central limit theorem, the mean of a sampling distribution of the mean is the same as the ______ of the parent population.
5.24 According to the central limit theorem, we can calculate the standard error of the mean if we know the ______ of the population and the ______ of the sample.
5.25 If we don’t know σ, we can use ______ to estimate the standard error of the mean.
5.26 If the standard error of the mean is small, that’s an indication there is ______ sampling error.
5.27 A confidence interval is a ______, based on a _______ value, within which it is estimated that the _______ value falls.
5.28 A confidence interval is an interval ______, not a _______ estimate.
5.29 Within ______ standard errors of the mean of the midpoint of a sampling distribution of the mean, 95% of the means fall.
5.30 A mean picked at random from a sampling distribution of the mean has a _______% chance of capturing the population mean if 1.96 σM brackets are extended from it.
5.31 If a 95% confidence interval ranges from 7.32 to 13.68, it would be written in APA format as _______.
5.32 If a 95% confidence interval is calculated, there is a _______% chance that it does not capture the population mean.
Apply Your Knowledge
Using the random number table
5.33 There are 50 people in a class. The teacher wants a random sample of 10 students. She numbers the students consecutively (1, 2, 3, 4, . . . 50) and uses the random number table to sample 10 cases without replacement. She starts on the first line of the table and uses it like a book, moving from left to right on each line. She divides each four-digit random number into two two-digit numbers. If the first number were 1273, she would read it as 12 and 73. List the numbers of the 10 cases in her sample.
5.34 A dean wants a random sample, without replacement, of 10 students from the first-year class. There are 423 students in the first-year class. Assign numbers consecutively to the students, use the random number table starting at row 6, and use the last three digits of a number (e.g., 1273 would be read as 273). List the numbers of the 10 cases in her sample.
Evaluating samples
5.35 At an alcohol treatment center, about 10 people with alcohol problems complete treatment each month. The director wants to know their status a year after treatment. By 2014, 112 people had completed treatment. In 2015 she hires a researcher to track down all 112 and assess their status one year after treatment. He manages to locate 86 of the 112, or 77%. Of those 86, 66 agree to be interviewed. 66 is 77% of 86 and 59% of 112. Should the director pay attention to the results of the survey? Why or why not?
171
5.36 The mayor of a large city wants to know how optimistic new mothers are about their children’s future in the city. There were 1,189 live births in the city in 2015. The mayor commissions a researcher who randomly samples 120 of the new mothers. That’s a target sample of a little more than 10% of the population. The researcher approaches the target sample, explains the study to them, and tries to obtain their consent to participate. Ninety-four (78%) of those approached give consent and participate. Should the mayor pay attention to the results of the survey? Why or why not?
Calculating the standard error of the mean
5.37 Given σ = 4 and N = 88, calculate σM.
5.38 Given σ = 12 and N = 88, calculate σM.
5.39 Given s = 7.50 and N = 72, calculate sM.
5.40 Given s = 7.50 and N = 225, calculate sM.
Calculating confidence intervals (Report answers in APA format.)
5.41 If σM = 4 and M = 17, what is the 95% confidence interval for the mean?
5.42 If sM = 8, and M = –12, what is the 95% confidence interval for the mean?
5.43 If s = 17, N = 72, and M = –12, what is the 95% confidence interval for the mean?
5.44 If σ = 11, N = 33, and M = 52, what is the 95% confidence interval for the mean?
Expand Your Knowledge
5.45 According to the central limit theorem, a sampling distribution of the mean will approach a normal distribution as long as which of the following is true?
At least 30 random, repeated samples are drawn.
The population has at least 30 cases.
Each repeated, random sample has at least 30 cases.
The size of the population standard deviation is at least 30.
The size of the population standard deviation is less than 30.
σ, not s, is used to calculate the standard error of the mean.
5.46 Charlotte obtains a random sample of 120 students from a university, finds out each person’s age, and calculates M and s. Why is M not exactly equal to μ?
The sample is random.
The sample size is >50.
The sample is not large enough.
This is due to sampling error.
The population value for μ was wrong.
The central limit theorem does not apply when μ is known.
This could not occur.
5.47 If sample size is held constant, how does the size of the population standard deviation affect the size of the standard error of the mean?
5.48 If standard deviation is held constant, how does the size of the sample affect the size of the standard error of the mean?
5.49 Given N = 81, σ = 12, and M = 100, calculate a 90% confidence interval for the population mean.
5.50 Which would be narrower, a 90% confidence interval or a 99% confidence interval?
5.51 What can be done to make a 95% confidence interval narrower?
172
SPSS
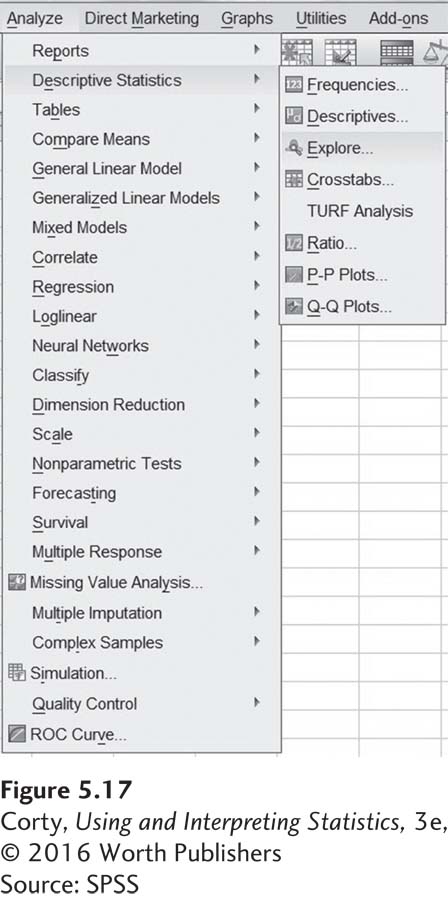
There’s not much that SPSS does with regard to sampling distributions. All the descriptive statistics procedures covered in Chapter 3—frequencies, descriptive, and explore—do calculate the standard error of the mean. To develop a sense of how much sampling error exists in a sample, use descriptive statistics to find the standard error of the mean.
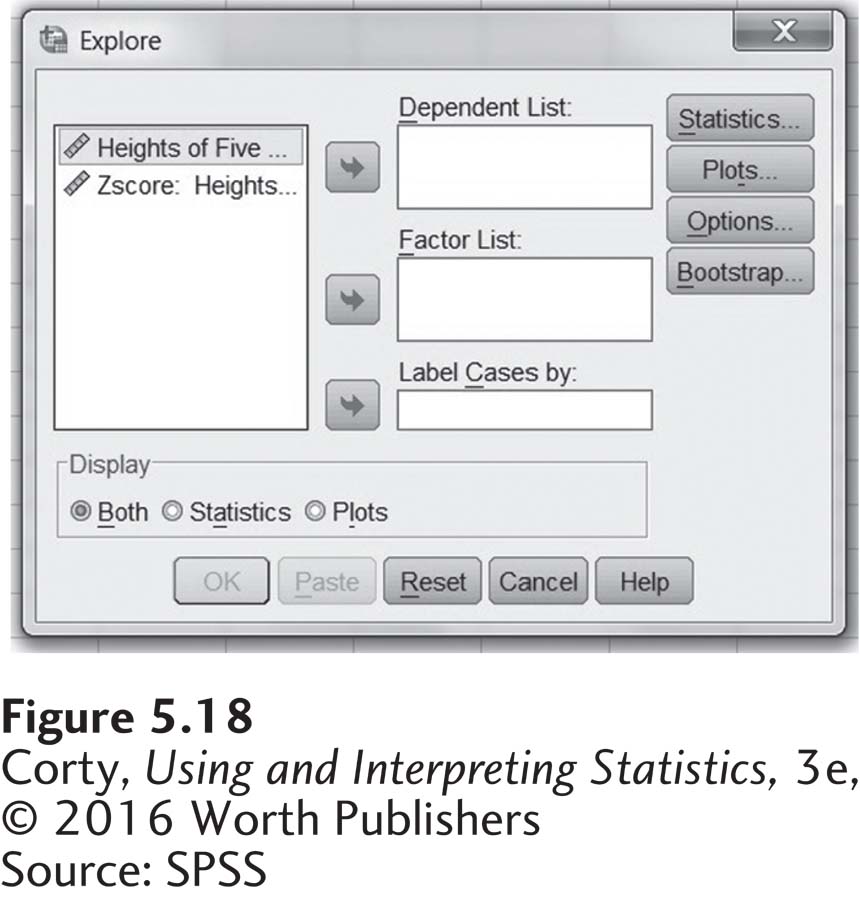
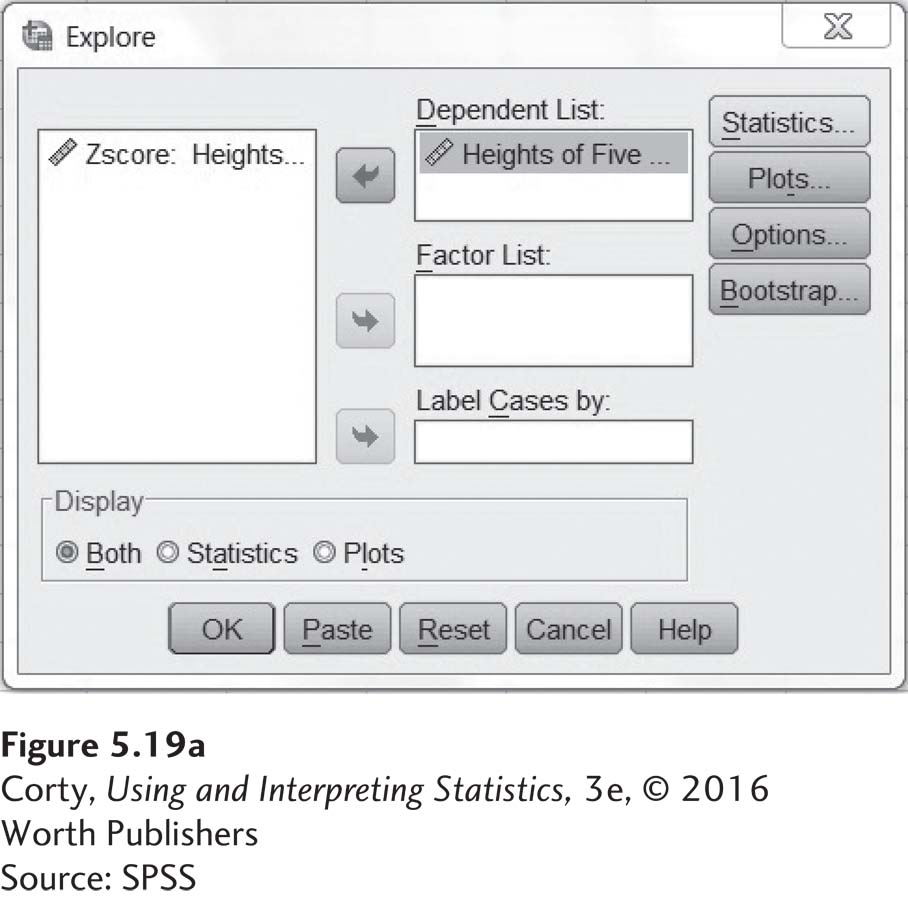
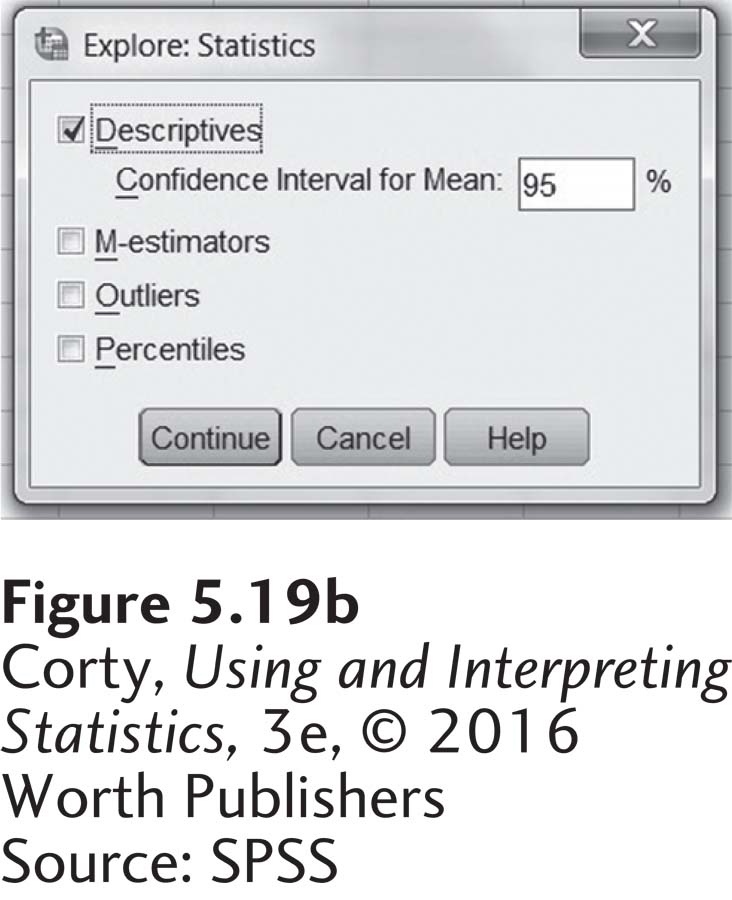
SPSS can calculate a confidence interval for the mean with whatever percentage of confidence is desired. To do so, go to “Analyze,” then “Descriptive Statistics,” then “Explore.” See Figure 5.17. This opens up a new menu box, as shown in Figure 5.18. Once the variable for which the confidence interval is desired has been moved into the “Dependent List” box, click on “Statistics. . . .” Another box opens up, with the default value of a 95% confidence interval already selected. This can be changed to any value, though the most common other ones are 90% and 99%, as seen in Figure 5.19.