501.1 Chapter Introduction
173
PART I
Test Your Knowledge
These questions are meant to probe your understanding of the material covered in Chapters 1–5. The questions are not in the order of the chapters. Some of them are phrased differently or approach the material from a different direction. A few of them ask you to use the material in ways above and beyond what was covered in the book. This “test” is challenging. But, if you do well on it or puzzle out the answers using the key in the back of the book, you should feel comfortable that you are grasping the material.
1. Answer each part. All questions refer to a normal distribution. For IQ, μ = 100 and σ = 15.
What percentage of scores fall from the mean to 2.33 standard deviations below the mean?
What percentage of scores fall at or above z = 0.93?
What percentage of scores fall at or above z = –1.37?
What percentage of scores fall from z = –0.23 to z = 1.84?
What percentage of the world’s population would be classified as geniuses if to be a genius one must have an IQ ≥150?
What was Buffy’s score on the IQ test if her score, as a PR, were 33.
On each SAT subtest, Skip’s score was 670. He is planning to take the ACT. If he performs as well on the ACT as he did on the SAT, then what would his ACT score be? (Assume the ACT has a mean of 21.50 and a standard deviation of 5.)
What percentage of scores fall from z = 1.23 to z = 2.23?
2. Answer each part.
Make a stem-and-leaf plot for these data: 11, 31, 61, 62, 44, 54, 33, 32, 36, 45, 47, 55, 52, 19, 22, 33, 24, 28, 48, 26, 58, 44, 33, 36
Based on the frequency distribution for the Irrational Beliefs Scale shown in the following table, answer the following questions:
i = _____________
What are the apparent limits for interval D?
What is the real lower limit for interval G?
What is the real upper limit for interval H?
What is the midpoint for interval E?
N = ________________
What is the unit of measurement for the Irrational Beliefs Scale?
Frequency Distribution: Irrational Beliefs Scale
| Interval | Frequency | Cumulative Frequency |
|
| A | 37–40 | 4 | 150 |
| B | 33–36 | 10 | 146 |
| C | 29–32 | 17 | 136 |
| D | 25–28 | 27 | 119 |
| E | 21–24 | 30 | 92 |
| F | 17–20 | 25 | 62 |
| G | 13–16 | 16 | 37 |
| H | 9–12 | 11 | 21 |
| I | 5–8 | 7 | 10 |
| J | 1–4 | 3 | 3 |
3. Answer all parts.
Given 7, 9, 4, 11, and 14,
∑X = _______________
M = ____________
∑(X – M) = _____________
∑(X – M)2 = _____________
s = _________
Mdn = ______________
4.
For a sample of 50 cases from a population, put these in order from smallest to largest: σ, σ2, s, s2: _________________________
Assume that conscientiousness is normally distributed. A researcher develops a new way to measure it. If almost 100% of the scores fall from 15 to 45, then s = __________.
174
5. Answer both parts.
A researcher obtained a random sample of 75 teenagers from the United States. She had each teenager keep track of how many times he or she checked his or her phone for texts or tweets during one 24-hour period. Given M = 157 and s = 32, calculate the 95% confidence interval for the population mean for the number of times a teenager checks.
Explain what this confidence interval means.
6. For each scenario, indicate whether the design is correlational (C), experimental (E), or quasi-experimental (QE). For the variable in bold, indicate whether it is a predictor variable (PV), criterion variable (CV), independent variable (IV), dependent variable (DV), or grouping variable (GV).
A psychologist is curious if sex has an impact on anxiety. She observes male and female nurses as they give shots to patients. Just before the injection, she asks the patients to rate how anxious they are.
A researcher is curious how color affects children’s activity levels. He takes a noncolorful breakfast cereal and dyes it in bright colors. When a child comes to his lab, he randomly assigns him or her to receive the colorful or noncolorful version. He then lets the child play in a ball pit and times, to the nearest second, how long he or she plays.
A researcher thinks it is eyes that control how attractive a person is. She gets a sample of college students and takes high-resolution images of their faces. She prepares two sets of photos, one of their full faces and one of just their eyes. She goes to another college and assembles two panels of raters. One panel rates how attractive the eyes are and the other panel rates the faces. Each panel rates on a scale of 0 to 100.
Can humans echolocate? A researcher advertises for subjects who don’t mind getting bruises and 20 volunteers show up. He randomly assigns them to two groups. He teaches one group to click their tongues and listen for the sound to bounce back. He teaches nothing to the other group. He then puts each person in a totally dark room that is filled with obstacles like chairs and tables for ten minutes. The volunteer is instructed to walk around and form a mental map of the room. While each person is walking around the room, the researcher counts how many times he or she bumps into an object.
Does fussiness as a baby predict fussiness as an adult? A psychologist has mothers classify their babies as fussy or not. Thirty years later, she tracks down the babies and has their spouses rate them on a scale that measures how difficult they are to please.
7. Given an interval-level variable, make a grouped frequency distribution. Use i = 10, start the lowest interval at 20, and report the midpoint, f, fc, %, and %c. The data are given below—note that they are already organized from low to high.
| 26 | 40 | 47 | 51 | 55 | 61 |
| 30 | 40 | 47 | 51 | 56 | 61 |
| 33 | 41 | 47 | 52 | 57 | 62 |
| 33 | 42 | 48 | 53 | 57 | 64 |
| 33 | 43 | 48 | 53 | 57 | 65 |
| 36 | 45 | 48 | 54 | 59 | 65 |
| 38 | 45 | 48 | 54 | 59 | 67 |
| 39 | 45 | 50 | 54 | 59 | 72 |
| 39 | 45 | 50 | 54 | 59 | 73 |
| 40 | 46 | 50 | 54 | 61 | 75 |
8. For each scenario below, determine the level of measurement of the variable in bold.
Adopted children are compared to nonadopted children on the 25-item Smith Attachment Checklist to see whether adoption status affects attachment level.
A researcher believed that amount of sleep influenced learning ability. He had participants keep a sleep diary for a week, so he could calculate the average number of hours each slept per night. He then had each subject memorize a list of 25 words, gave him or her a distractor task, and observed how many of the 25 words each could recall.
A researcher thought that amount of sleep influenced learning ability. She got 20 volunteers and randomly assigned them to two groups. Group A slept for 8 hours a night, for three nights in a row. Group B slept for 4 hours a night, for three nights in a row. After the three nights, each participant read a newspaper article about a chef who was mugged while walking home from work. Then, each person took a surprise recall test about 20 facts from the article. It was scored based on the percentage of facts correctly recalled.
A researcher is curious how well a student’s score on an initial statistics test predicts how much statistics he or she ends up knowing, as measured by the final point total in the class. He takes a random sample of 100 students from previous semesters, determines each person’s score on the first test, and then finds his or her final point total.
A sexual assault researcher believes that alcohol consumption leads to being in situations where assault is more possible. To investigate this assumption, she obtains a representative sample of 3,500 U.S. college students and classifies them as (0) nondrinkers, (1) people who drink 1–3 days per month, (2) 4–7 days per month, (3) 8–13 days per month, (4) 14–24 days per month, (5) 25–29 days per month, and (6) every day. Each participant also reports how many sexual experiences he or she had under the influence that he or she now regrets. The researcher compares the number of regretted sexual experiences across the different classifications of drinking days.
175
9. Round the following to two decimal places.
12.4550
13.4105
14.7812345
15.9937
16.99
2/3
3/2
10/2
4.00/2.00
10. Graph the following data: Intro psych students were surveyed regarding textbook use. Ten bought a new textbook; 32 bought a used version; 21 bought a looseleaf version; 23 were renting their copy; and 7 did not have a textbook.
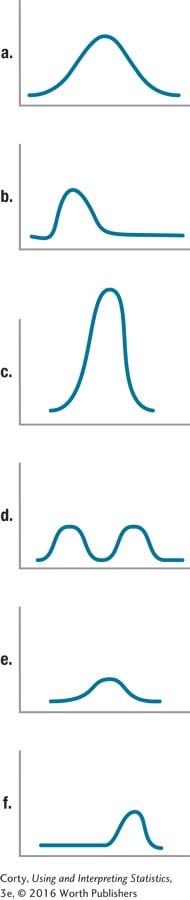
11. Determine the shape of each distribution.