Equilibrium in the Market for Loanable Funds
The market for loanable funds occurs when suppliers of loanable funds (savers) trade with demanders of loanable funds (borrowers). Trading in the market for loanable funds determines the equilibrium interest rate.
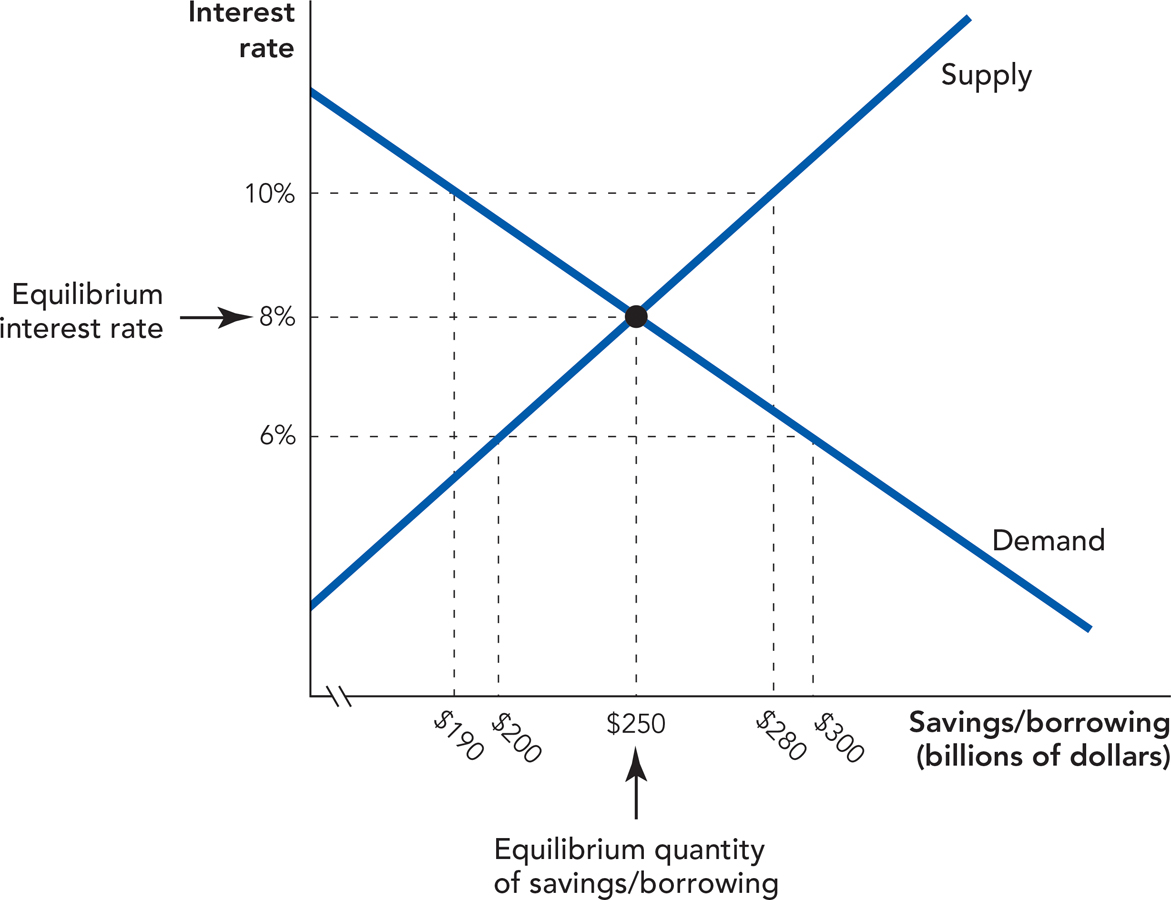
Now that we have covered the supply of savings and the demand to borrow, we can put them together to find an equilibrium in what economists call the market for loanable funds. In Figure 9.6, the equilibrium interest rate is 8% and the equilibrium quantity of savings is $250 billion. Notice that in equilibrium, the quantity of funds supplied equals the quantity of funds demanded.

The interest rate adjusts to equalize savings and borrowing in the same way and for the same reasons that the price of oil adjusts to balance the supply and demand for oil. If the interest rate were higher than 8%, the quantity of savings supplied would exceed the quantity of savings demanded, creating a surplus of savings. With a surplus of savings, suppliers will bid the interest rate down as they compete to lend. If the interest rate were lower than 8%, the quantity of savings demanded would exceed the quantity of savings supplied, a shortage. With a shortage of savings, demanders would bid the interest rate up as they competed to borrow. (See Chapter 4 for a review.)
Shifts in Supply and Demand
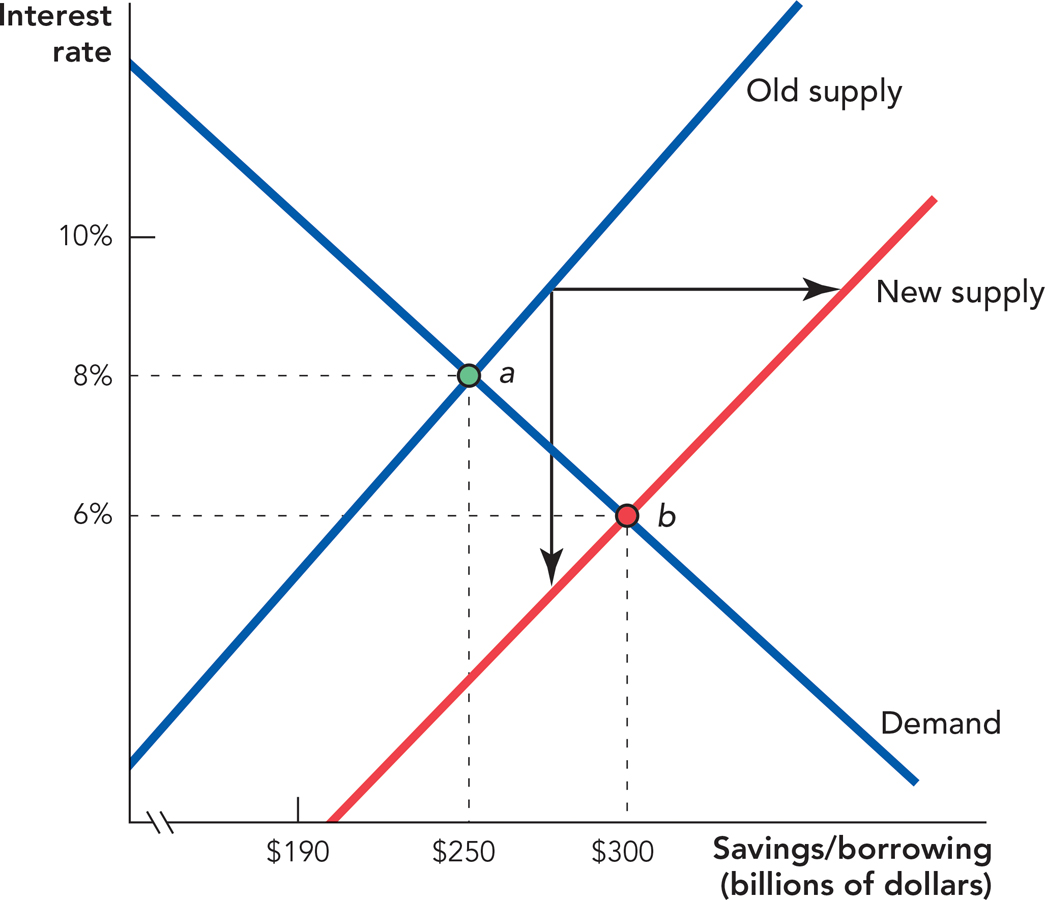
Changes in economic conditions will shift the supply or demand curve and change the equilibrium interest rate and quantity of savings. Consider an economy in which the citizens become less impatient, and more willing to save for the future. These shifts occurred in South Korea in the 1960s and 1970s, once many Korean citizens realized they could copy some aspects of the Japanese economic miracle. Across East Asia more generally, growing life spans and fewer children to support (and fewer children to be supported by, in old age) led to a regional savings boom. An increase in the supply of savings is shown by shifting the supply curve to the right and down (indicating more savings at any interest rate or, equivalently, a willingness to save any given amount in return for a lower interest rate).
183

In Figure 9.7, an increase in the supply of savings causes the equilibrium interest rate to fall from 8% to 6% and the quantity of savings to increase from $250 billion to $300 billion.
What did this shift in savings mean for South Korea? In 1960, Korea was among the poorest countries in the world but today it is a fully developed nation. South Korea’s increased savings were plowed into investment and, as we know from our discussion of the Solow model in Chapter 8, one of the key drivers of economic growth is a high rate of investment and capital accumulation.
Of course, a decrease in the supply of savings is shown in the opposite manner, by shifting the supply curve to the left and up.

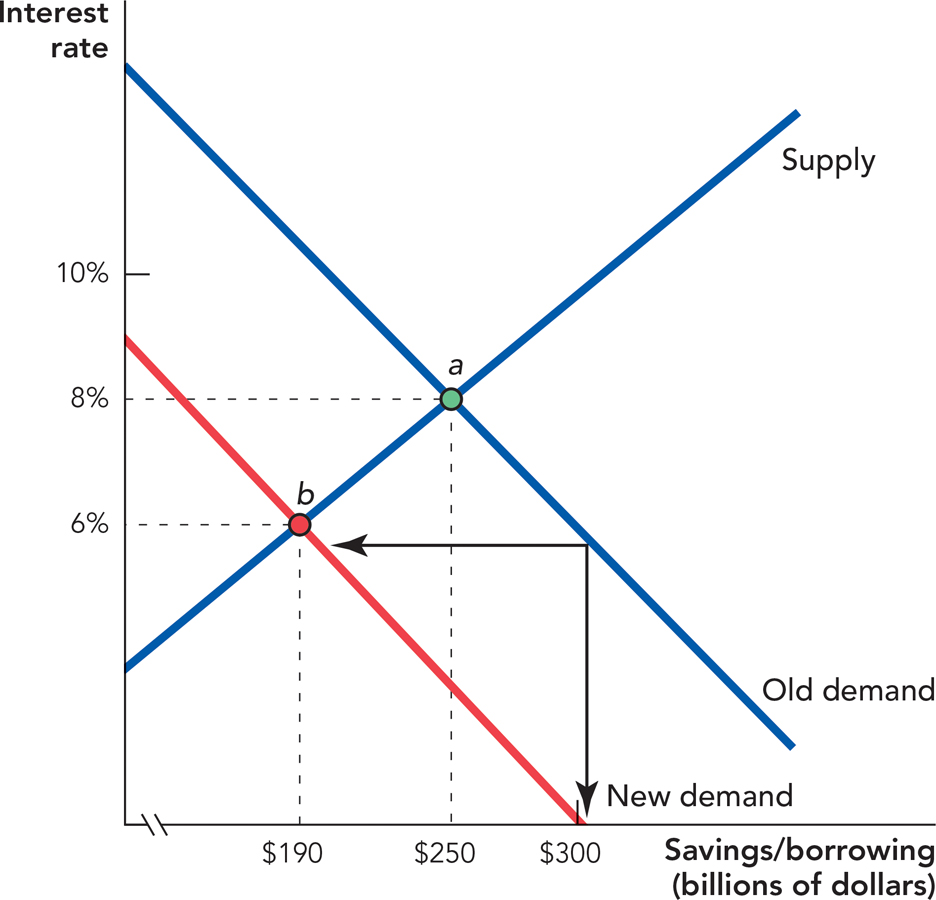
Sometimes investors become less optimistic, which decreases the demand to invest and borrow. For instance, during a recession many entrepreneurs get scared about the future and they are reluctant to invest. Projects that looked good to investors when the economy is booming may look unprofitable when the economy is in the doldrums. The decrease in investment demand can itself help to spread and prolong the recession, as we discuss at greater length in Chapter 14. In Figure 9.8, a decrease in investment demand reduces the interest rate from 8% to 6% and the quantity of savings from $250 billion to $190 billion.
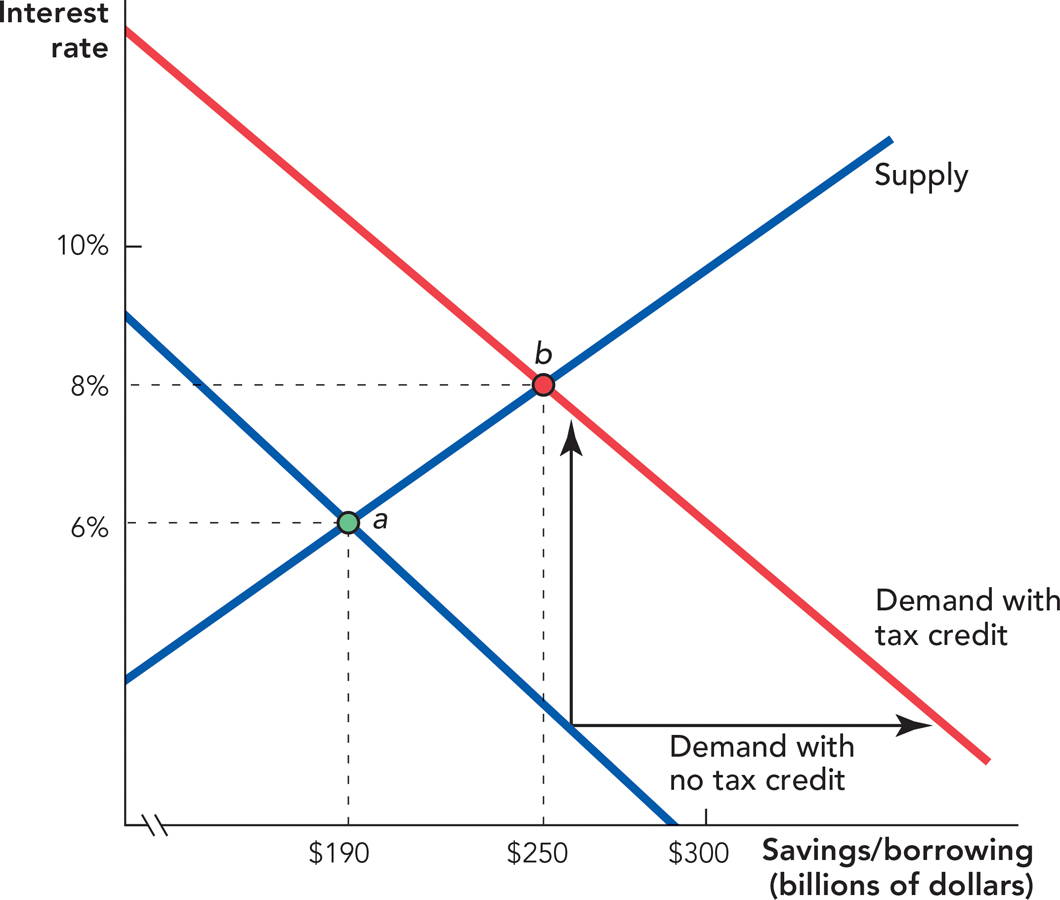
Sometimes, to counteract the decrease in investment demand during a recession, a government offers a temporary investment tax credit. An investment tax credit gives firms that invest in plants and equipment a tax break. The tax credit is usually temporary to encourage firms to invest quickly, when the recession is still in full force. The tax credit means that projects that were unprofitable without the credit are profitable with the credit, so at any given interest rate firms are willing to invest more when a tax credit is available. In other words, the demand to borrow funds shifts to the right (and up), as shown in Figure 9.9.

184
CHECK YOURSELF
Question 9.6
 How will greater patience shift the supply of savings and change the interest rate and quantity of savings?
Question 9.7
 How will an increase in investment demand change the equilibrium interest rate and quantity of savings?