CHAPTER REVIEW
FACTS AND TOOLS
Question 17.7
1.
Consider Figure 17.3. We can use these data to find out what percentage of federal taxes is paid from the “top down” by the top 40%, top 60%, or top 80% of income earners. Likewise, we can count from the “bottom up” by the bottom 40%, 60%, or 80% of income earners. Fill in the table.
Share of Total Federal Tax Revenue
Share of Total Federal Tax Revenue
Everyone
100%
Everyone
100%
Bottom 20%
0.8%
Top 80%
Bottom 40%
4.9%
Top 60%
Bottom 60%
Top 40%
85.6%
Bottom 80%
Top 20%
68.7%
Given these data, which of the following are true?
The bottom 60% of taxpayers pay less than 25% of federal taxes.
The top 80% of taxpayers pay over 98% of federal taxes.
The top 40% of taxpayers pay less than 60% of federal taxes.
Question 17.8
2. In 2013, corporate income taxes were about 9.9% of total federal revenue. Use Figure 17.6 to help estimate what fraction of GDP represents corporate income taxes.
Question 17.9
3.
Let’s explore the difference between the average income tax rate and the marginal income tax rate. In the simple land of Rabushka, there is only one tax rate, 20%, but workers don’t have to pay tax on the first $10,000 of their income. For every dollar they earn above $10,000, they pay 20 cents on the dollar to the Lord High Mayor of Rabushka.
The easy way to calculate the tax bill is the same way that America’s IRS does: Subtract $10,000 from each person’s income and call the remainder “taxable income.” Multiply taxable income by 0.20, and the result is “tax due.” Fill in the table.
Income
Taxable Income
Tax Due
Marginal Tax Rate
Average Income Tax Rate
$5,000
$0
0
0%
0%
$10,000
$0
0
0%
0%
$15,000
$5,000
$1,000
20%
6.7%
$20,000
$50,000
$100,000
$1,000,000
Is the marginal tax rate ever lower than the average tax rate?
As a worker’s income rises and rises past $1,000,000, will the average tax rate ever be greater than 20%?
Just to make sure you know what these terms mean in plain English: For an accountant making $50,000 per year, what percentage of her income goes to the Lord High Mayor?
Note: This simple tax system is quite similar to the plan that economist Robert Hall and political scientist Alvin Rabushka spell out in their book, The Flat Tax, widely available for free online. Hall and Rabushka estimate that a system like this one would raise roughly the same amount of revenue as the current federal income tax.
Question 17.10
4.
Do most federal government transfers of cash go to the elderly or to the poor?
384
Do most federal government purchases of health care go to the elderly or to the poor?
Question 17.11
5.
According to Table 17.1, which generation gets the best deal from Social Security: the one turning 65 in 1975, in 2010, or in 2030?
Out of the nine categories in Table 17.1, which kind of worker gets the best deal overall from Social Security?
Question 17.12
6. Based on the information in this chapter, let’s see who gets a better deal, a greater net benefit, from Social Security. In each pairing, choose one, or write “unclear.”
Women or men?
Married couples or singles?
People born in 1910 or people born in 1965?
High-income earners or low-income earners?
Question 17.13
7. There are a lot of ways to slice up the U.S. budget. With this in mind, which of the following statements are true, according to Figure 17.4?
Most of the federal budget is spent on welfare and foreign aid.
About half of the federal budget goes toward Medicare, Medicaid, and Social Security combined.
More than half of the federal budget goes toward Medicare, Medicaid, Social Security, and interest on the debt combined.
The federal government spends about $1,830 on the military per person in the United States.
Question 17.14
8. Pundits and commentators often state (correctly) that entitlement spending (spending on Medicare, Medicaid, and Social Security) is going to explode in the future. But by lumping all three together, we obscure the source of the explosion.
Which of the three really won’t be “exploding” all that much compared to the other two?
Which category of federal spending is projected to actually decline in future decades?
THINKING AND PROBLEM SOLVING
Question 17.15
1. By U.S. law, your employer pays half of the payroll tax and you, the worker, pay the other half. We mentioned that according to the basics of supply and demand, the part of the tax paid by the employer is likely to cut the worker’s take-home pay. Let’s see why. We’ll start off in a land without any payroll taxes and then see how adding payroll taxes (like FICA and Medicare) affects the worker’s take-home pay.
Who is it that “supplies labor”? Is it workers or firms? And who demands labor? Workers or firms?
The following chart illustrates the pretax equilibrium. Mark the equilibrium wage and quantity of labor in this market. In part c, remember that this “wage” is the amount paid directly to workers.
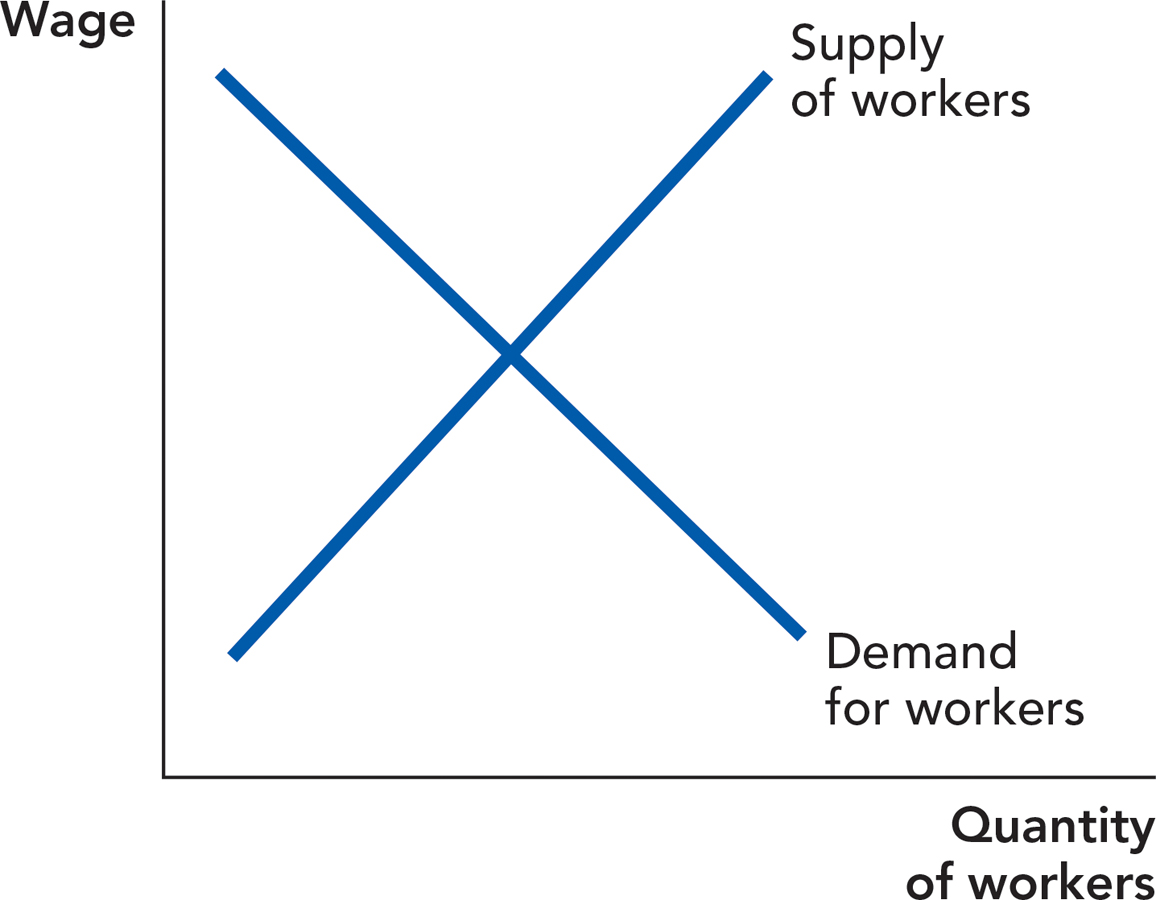
Suppose the government enacts a new payroll tax of 10% of worker wages, “paid” fully by employers. What will happen to the typical firm’s demand for labor? In other words, when firms learn that every time they hire a worker, they have to pay not only that worker’s wage but also 10% of that worker’s wage to the government, will that increase or decrease their willingness to hire workers? After you answer in words, also illustrate the shift in the graph.
So, in the equilibrium with a new fully employer-paid payroll tax, will worker’s take-home wages be higher or lower than beforehand?
Imagine that most workers want full-time jobs to support their families whether the wage is high or low. What does this imply about the shape of the supply curve? Redo the analysis with the new supply curve and discuss the exact effect on wages of the payroll tax.
385
Question 17.16
2. It’s easy to confuse the “federal deficit” with the “federal debt.” We’ll work out an example to make the differences clear. To keep the math simple, we’ll falsely assume that in this land of Barrovia, the government can borrow from the public at an interest rate of 0%—so there is no interest on the debt. We will also assume that the government is unwilling to print money to finance its budget, so the only way to finance a deficit is by borrowing. The debt inherited from 2011 is 4,000 credits (C4,000, in the local notation). Fill in the accompanying table.
Note: The relationship between deficits and debts is similar to the relationship between investment and the capital stock, which we investigated back in Chapters 7 and 8: The first is a “flow,” while the second is a “stock”; the first is like a river, while the second is like a lake.
|
Year |
Revenue |
Spending |
Deficit |
Debt |
|---|---|---|---|---|
|
2012 |
C100 |
C120 |
C20 |
C4,020 |
|
2013 |
C80 |
C130 |
C50 |
|
|
2014 |
C110 |
C140 |
||
|
2015 |
C120 |
C150 |
||
|
2016 |
C120 |
C160 |
Question 17.17
3. Social Security is primarily a pay-as-you-go program, which means that the government pays retirees their promised benefits by taxing today’s workers. Imagine that Social Security moved to a fully funded program in which today’s workers (or the government on their behalf) invested in assets, such as stocks and bonds, to pay for their own retirement.
Discuss some of the costs and benefits of a fully funded program.
Discuss some of the difficulties of transitioning to the new system. (Hint: If today’s workers pay for their own future retirement, who will pay today’s retirees?)
Question 17.18
4. Calculating taxes on capital gains takes a little work, but if you buy and sell stocks, bonds, works of art, or homes, you’ll probably have to do this at some point. Let’s practice. In a few of the following cases, the price will fall—just record that as a negative rise (a “capital loss,” in tax jargon). (In some cases, you can use these to offset taxes on capital gain but we won’t get into that detail here.)
Fill in the table.
Item
Purchase Price 2015
Sale Price 2020
Capital Gain
Tax Due at 15% Rate
10 Shares of Microsoft Stock
$1,200
$1,250
$50
$7.50
1 Share of Berkshire Hathaway stock
$8,000
$11,000
100 Shares of GM stock
$1,000
$500
1 Picasso napkin sketch
$15,000
$14,000
1 Mexican Amate folk painting
$2,000
$3,500
One nice thing about the capital gains tax is that you can choose what year to pay it by choosing what year to sell your investment. If you wanted to sell your single share of Berkshire stock and your Picasso in the same year, how much tax would you pay?
Question 17.19
5. How big is the tax break from the $3,950-per-child income tax deduction for:
Families in the 10% tax bracket?
Families in the 25% tax bracket? (Hint: This is worked out in the chapter.)
Families in the 35% tax bracket?
Question 17.20
6.
If 1% of federal spending goes toward foreign aid, then what percent of U.S. GDP goes toward foreign aid? Figures 17.4 and 17.6 will help.
If 20% of federal spending goes toward defense spending, then what percent of U.S. GDP goes toward defense spending?
If $30 billion of federal spending goes toward earmarked appropriations, what percent of federal spending goes toward earmarks?
Question 17.21
7. Some people argue that a large national debt will make future generations poorer. One way to test this is to see what happened after the last time the United States had a large national debt: after World War II. As Figure 17.5 shows, the debt-to-GDP ratio was over 100%, a bit higher than even today’s ratio. Let’s compare this to Figure 6.3 and Figure 11.5, which show the growth rate of GDP and the unemployment rate, respectively.
386
During the 1950s, was the growth rate lower than average? How about during the 1960s?
During the 1950s, was the unemployment rate higher than average? How about during the 1960s?
Overall, is it fair to say that the two decades after the massive World War II debt were worse than average?
Note that this single case doesn’t count as conclusive proof: Perhaps the United States just got lucky, or the federal government did an unusually good job spending its World War II expenditures to build up its capital stock (a point emphasized in the excellent Francis Ford Coppola film Tucker: The Man and His Dream), or perhaps a massive short-term debt doesn’t cause much economic trouble. You can learn more about these possible explanations in other economics courses.
Question 17.22
8. Which of the following actual government programs show up as costs in the federal budget?
The Department of Labor mandates the minimum wage for workers.
The Environmental Protection Agency mandates that cars have equipment to keep pollution levels low.
The National Oceanic and Atmospheric Administration forecasts the weather.
The Coast Guard rescues sailors from a sinking yacht off the coast of Cape Cod.
The Border Patrol requires that all vehicles driving on highways out of San Diego be stopped to inspect for the presence of illegal aliens.
CHALLENGES
Question 17.23
1. In 1989, Senator Bob Packwood asked Congress’s Joint Committee on Taxation how much extra revenue the government would raise if it just started taxing 100% of all income over $200,000 per year. The Joint Committee crunched some numbers and reported an answer: $204 billion per year.
What is wrong with this answer?
Under Packwood’s proposal, what would the marginal tax rate be at $250,000 per year? At $500,000 per year?
Note: Packwood asked the Joint Committee this question not because he wanted to raise taxes that high, but to make a point. The tale of his efforts—and the efforts of Ronald Reagan, Dan Rostenkowski, Bill Bradley, and many others—to improve the U.S. tax code in the 1980s is compellingly told in Birnbaum and Murray’s book Showdown at Gucci Gulch: Lawmakers, Lobbyists, and the Unlikely Triumph of Tax Reform.
Question 17.24
2. Today, many government transfer programs are run through the tax code. The Earned Income Tax Credit (EITC), which we discussed in this chapter, is one important example. The federal government also has a variety of other “refundable tax credits,” that is, spending programs run through the tax code. These blur the line between “tax breaks” and “government spending.” This may explain their popularity: Voters and politicians who like tax breaks can claim that these programs are tax breaks, while voters and politicians who like higher government spending can claim that these programs are government spending.
Your income is $20,000 per year. You pay your initial tax bill of $5,000 but the government sends you a $1,000 tax refund because you have a young child. What is your after-tax income, including the value of the government check?
Your income is $20,000 per year. You pay your initial tax bill of $5,000 and the government sends you a $1,000 check because you have a young child. What is your after-tax income, including the value of the government check?
Your income is $20,000 per year. You pay your initial tax bill of $500 but the government sends you a $1,000 tax refund because you have a young child. What is your after-tax income, including the value of the government check?
Your income is $20,000 per year. You pay your tax bill of $500 and the government sends you a $1,000 check because you have a young child. What is your after-tax income, including the value of the government check?
387
In which of these cases does the government check seem like “government spending” to you, and why? You may find more than one case applicable—this question borders on the philosophical.
Question 17.25
3.
If the debt-to-GDP ratio rose to 100% and the interest rate on the debt were 5% per year, what fraction of GDP would go toward paying interest on the debt?
If this happened, would interest on the debt be a bigger share of GDP than Social Security is today?
In your opinion, do you think that Americans would tolerate spending this much of the national income on interest payments for past spending? More important, do you think Americans would want their politicians to stop making the interest payments and just default on some or all of the federal debt? Why or why not?
Question 17.26
4. Currently, the U.S. government offers “food stamps” to poor Americans. These “stamps” are pieces of paper that look like Monopoly money and can be spent just like money at many grocery stores. The government has a complex formula that determines how much each poor person gets each month in food stamps (or more often these days, government-provided debit cards).
Let’s suppose that instead, the government decides to pay 95% of every poor person’s food bill, as long as it is purchased at a typical grocery store: The poor person would make a “copayment” of 5% of the total bill, and the federal government would reimburse the grocery store for the remaining 95%. Just to keep things simple, let’s assume that the government has a good way to make sure that poor people can’t resell this food to others.
Which method would probably lead to more spending on food: the current method or the 5% copayment method? Why?
If food companies like Kellogg’s and Quaker Oats start inventing new, more delicious dishes at a rapid rate, under which method will the federal government’s food spending grow fastest: the current method or the 5% copayment method?
Which method is more like how most people pay for health care including the elderly and the poor under the federal government’s Medicare and Medicaid programs: the current method or the 5% copayment method?
Recall that health care is a field of rapid innovation. How can your answer to parts b and c explain the rapid growth of medical spending?
Question 17.27
5. When discussing the statements sent to you by the federal government that predict your future Social Security payments, we said, “Don’t be surprised if those predictions turn out to be a little bit optimistic.” Consider why this might be wrong: Why might these predictions be too pessimistic, precisely because Social Security recipients are also voters? (Hint: Senior citizens are more likely to vote than younger citizens.)
!launch! WORK IT OUT
Under current law, homeowners get a big tax break: The details of the tax break really don’t matter as much as the mere fact that if you make mortgage payments on a home that you live in, your taxes will be lower than otherwise.
Suppose that Congress eliminated the tax break for homeowners. What will this law do to the demand for homes: raise, lower, or have no impact?
What will be the net effect of eliminating the break on the price of houses?
Given your answers to parts a and b, comment on who gets the benefits of the tax break. Is it people who buy homes? Sellers? (Be careful, sellers were buyers once!) Why could eliminating the tax break prove difficult?
* In fact, exactly this situation occurred in Chile when it privatized its social security program in 1981. Beginning in 1981, employers no longer had to pay social security taxes for their employees. The fall in employer taxes, however, did not result in extra profits. Instead, wages rose as the payroll tax fell—exactly as predicted by tax incidence theory. Other studies in the United States show that when the government mandates that firms provide benefits to their employees such as health benefits, wages fall. Thus, employees rather than employers pay for mandated benefits. On Chile and for references to other studies, see Gruber, J, 1997. The incidence of payroll taxation: Evidence from Chile, Journal of Labor Economics 15(3), S:72–S101.
388