The National Debt, Interest on the National Debt, and Deficits
The final category of spending we will discuss is interest on the national debt. If in 2014 you Googled the “U.S. national debt,” you would probably have found a number around $17.5 trillion, but quite a bit of this amount is held by other branches of the federal government. The Social Security Trust Fund, for example, holds billions of dollars in Treasury bonds, which simply represent an IOU on future Social Security payments.
The national debt held by the public is all federal debt held by indiviuals, corporations, and governments other than the U.S. federal government.
A better measure of our current debt is the national debt held by the public, which is all federal debt held by individuals, corporations, state or local governments, foreign governments, and other entities other than the federal government itself. The national debt held by the public is as of 2014 nearly $13 trillion. From now on when we talk about the national debt, the federal debt, or just the debt, we mean the national debt held by the public.
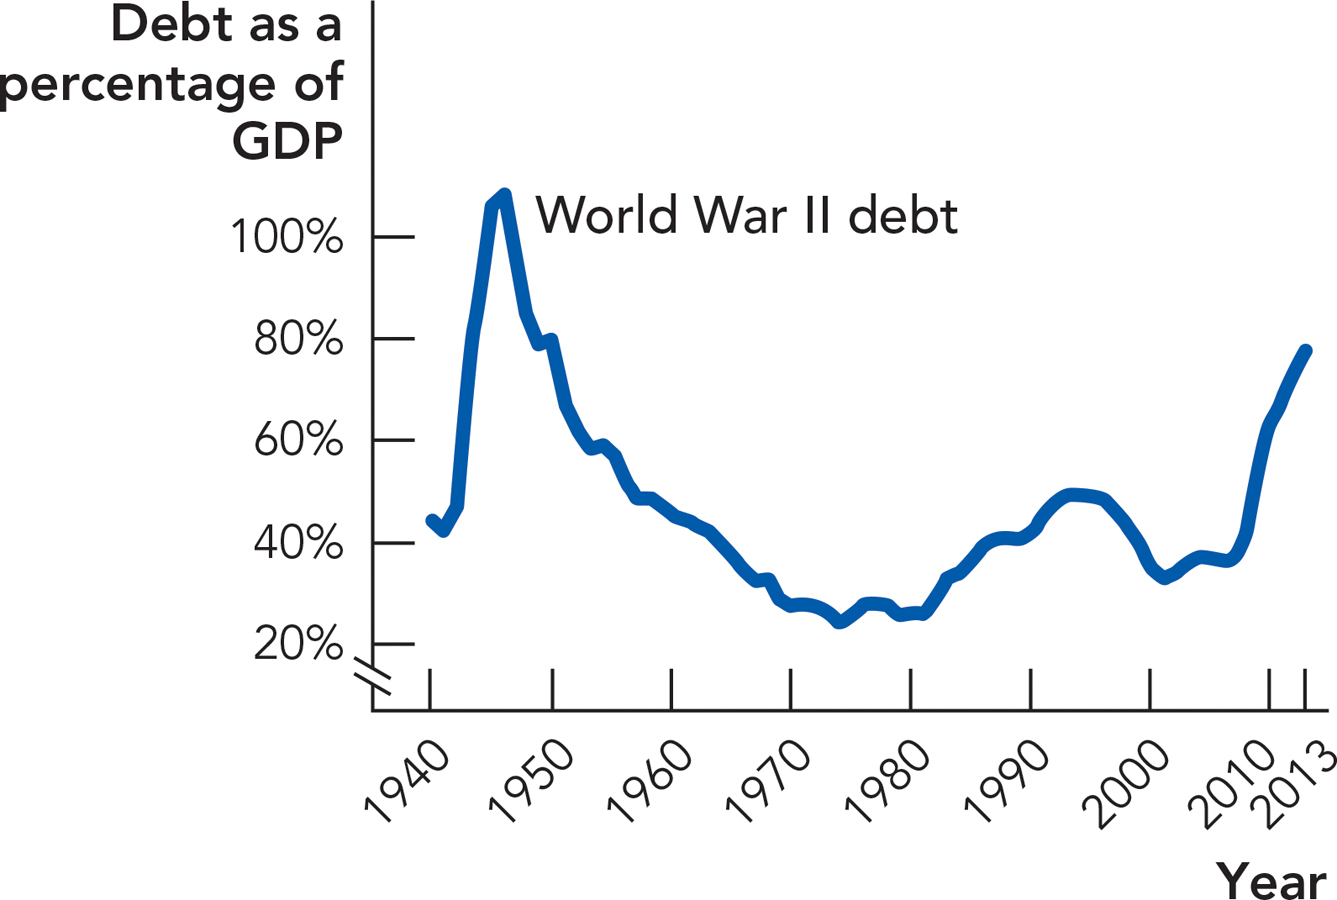
Thirteen trillion dollars is a very big number, but it has to be compared with another very big number, GDP, which is about $17 trillion. Thus, the United States has a debt-to-GDP ratio of over 70%. Is this a big number? Mortgage lenders often require a debt-to-income ratio of less than 36% so few people would recommend that you carry that much debt. The U.S. government will live for a lot longer than you or we will so for the federal government, this debt-to-GDP ratio is not excessive. Figure 17.5 shows the debt-to-GDP ratio since 1940. Today’s debt-to-GDP ratio of 73% is large but not as large as the ratio has been in the past. More worrying is that in 2007 the debt was only $5 trillion so the national debt is rising very quickly.

The highest debt-to-GDP ratio in U.S. history occurred in 1946 at 108%. As we discussed in Chapter 9, it makes sense for you to borrow to pay for large expenses, thereby smoothing your consumption, and the same thing is true for the U.S. government. The government borrowed heavily to finance emergency expenditures for World War II, but following the war the debt-to-GDP ratio slowly declined until the 1980s. In the 1980s, a combination of tax cuts and increases in defense spending increased the debt-to-GDP ratio. The ratio then fell as the economy expanded and the federal government briefly ran a series of budget surpluses under President Bill Clinton in the 1990s. More recently, the debt-to-GDP ratio increased slightly due to further tax cuts and defense spending under former President George W. Bush. The debt-to-GDP ratio increased sharply due to the recession that began in late 2007, which lowered GDP (hence raising the debt-to-GDP ratio), and led to increased government spending designed to stimulate the economy under President Barack Obama.
Every year, the government must pay interest to the people who lent it money, namely the bondholders. If your debt is $100 and the interest rate is 5%, then you owe the lender $5 a year in interest payments. It works the same way with the national debt. The national debt in 2014 was about $13 trillion and the average interest rate on U.S. debt in 2014 was about 2.4%, so in 2014 the federal government paid about $184 billion in interest payments to bondholders. An interest rate on the debt of 2% is extraordinarily low. In 2007, for example, the interest rate on the debt was 5%. The low rate in 2014 reflected the slow recovery from the most recent recession, which has meant that the U.S. government has been able to borrow cheaply. As the U.S. economy recovers, we can expect the interest rate to increase and, as it does, the interest on the debt that the U.S. government must pay will also increase. Interest on the debt will also increase as the debt-to-GDP ratio increases. As we discuss later in the chapter, we need to keep an eye on the national debt.
379
Sometimes television commentators suggest it makes a big difference if the debt of the U.S. government is held by foreigners or Americans. From a purely economic point of view, however, this distinction isn’t very important. What is important is how wisely the federal government spends the borrowed money If, years later, interest payments go to foreigners, that is because the foreigners offered to lend us money at the best rates. You can make a moral or ethical judgment that Americans ought to be spending less and saving more (which would mean less borrowing from foreigners), but low savings would be an even greater problem without foreign lenders.
The deficit is the annual difference between federal spending and revenues.
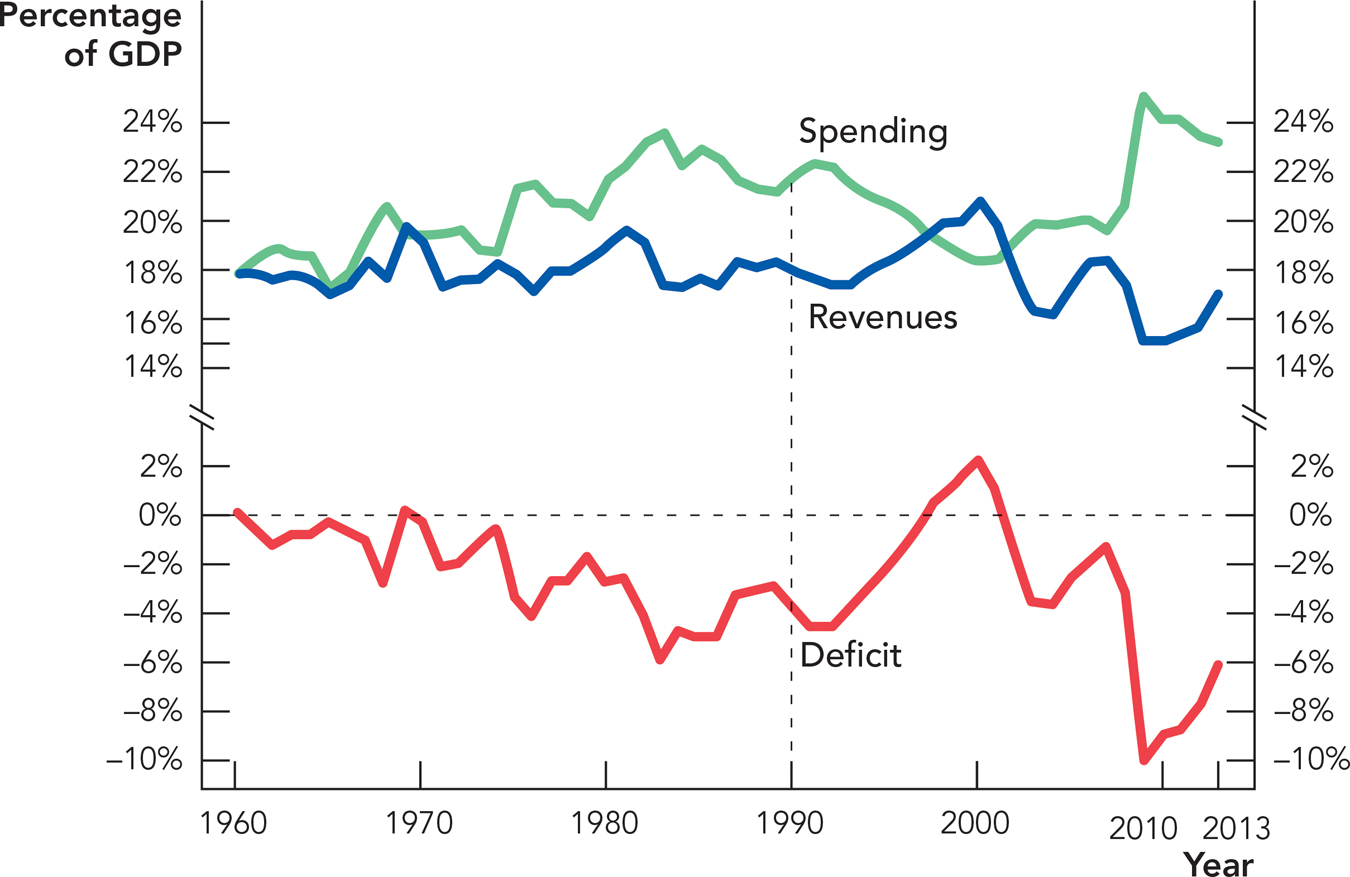
We now need to make a distinction between the national debt and the deficit. The debt is the total amount of money owed by the federal government at a point in time. It is a cumulative total of previous obligations. The deficit is the difference—this year—between what the government is spending and what the government is collecting in revenues. You can think of the deficit as the annual change in the national debt.
CHECK YOURSELF
Question 17.3
 When you retire, you will receive Social Security benefits and most Americans will also receive Medicare benefits. Right now, what percentage of federal spending is represented by Social Security plus Medicare payments?
Question 17.4
 Why is it important to consider the debt-to-GDP ratio rather than just the absolute amount of the national debt? What does this ratio tell us?
The top half of Figure 17.6 shows federal government spending (green) and revenues (blue) as a percentage of GDP from 1960 to 2013. When spending is greater than revenues, the government must borrow to make up the difference—the difference is the deficit, shown in the bottom half of Figure 17.6 also as a percentage of GDP (and as a negative value). In 1990, for example, the federal government spent almost 22% of GDP, but it collected only 18% of GDP in tax revenues. Since government spending was greater than revenues, the government had to borrow the difference, so in 1990 the deficit was about 4% of GDP (22% – 18%).

380