6 GDP and the Measurement of Progress
95
CHAPTER OUTLINE
What Is GDP?
Growth Rates
Nominal vs. Real GDP
Cyclical and Short-Run Changes in GDP
The Many Ways of Splitting GDP
Problems with GDP as a Measure of Output and Welfare
Takeaway
Avisitor to India is immediately struck by the contrast between extreme poverty and rapid economic growth. Squalor in India is obvious; two-thirds of India’s population lives on less than $2 a day (2010). Throughout India, you will see people living in the streets, children who have never been to school, fires burning on the sidewalk, and cripples begging for spare change.
But India’s growing wealth is also obvious: Cell phones are everywhere, new stores are opening, access to clean water is increasing, literacy is rising, and people are better fed. In the cities, there are more restaurants, more clothing shops, more factories, and more cars. India today has at least 100 million people at an American or European standard of living—a remarkable increase from just a few decades ago.
As a rough way of summarizing these changes in economic output and the standard of living, economists look to a country’s Gross Domestic Product (GDP) and its gross domestic product per capita, two statistics designed to measure the value of economic production.
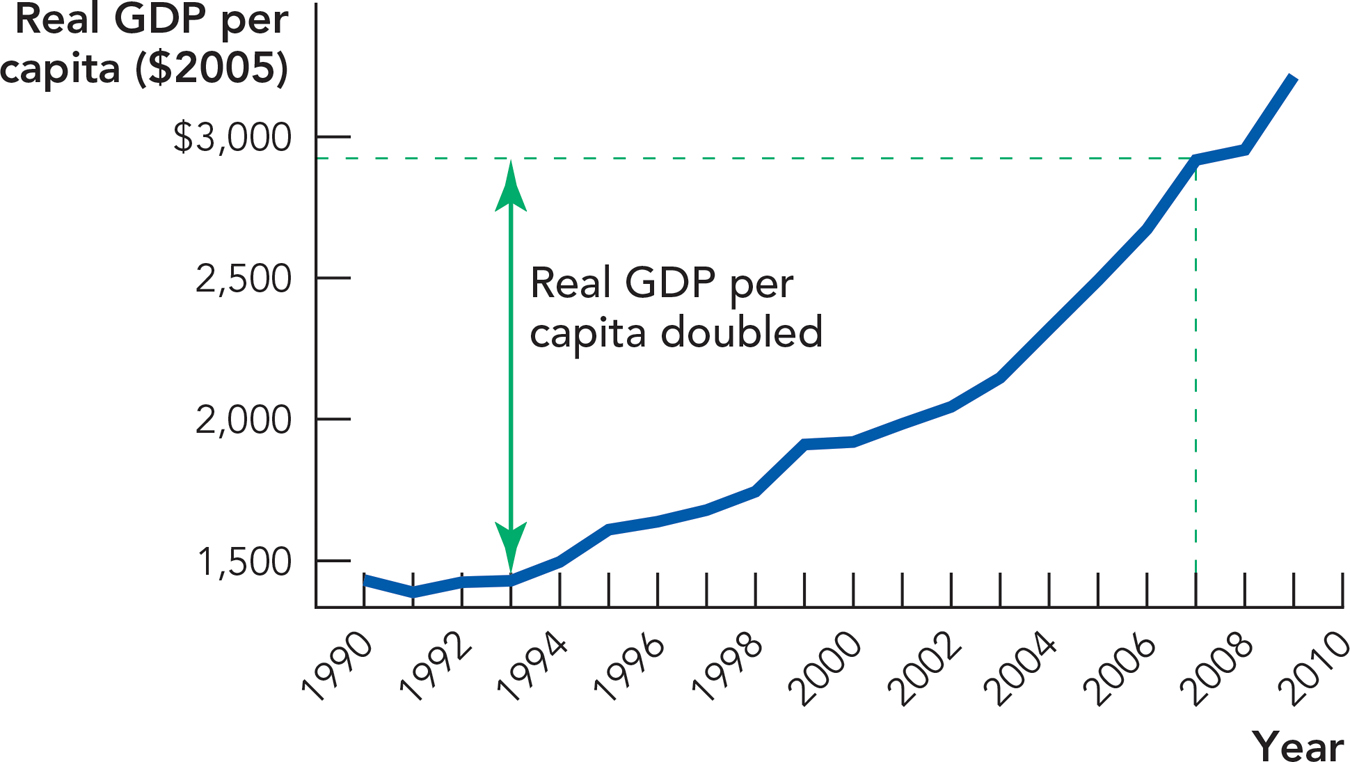
Figure 6.1 on the next page shows India’s real GDP per capita—or GDP per person—for the 14-year period, 1993-2007. Over this period, India’s real GDP per capita grew at an average rate of 5.1% a year. As we will discuss, real GDP per capita is a rough measure of a country’s standard of l iving. Thus, in the 14 years preceding 2007, the standard of living doubled. That is a notable improvement over India’s previous growth performance and it represents the growing wealth of many people in India.

Source: Penn World Tables.
Table 6.1 lists GDP and GDP per capita for the 10 largest economies circa 2010 (converted into U.S. dollars). In the United States, where GDP was $14.45 trillion and the population was 310 million, GDP per capita was $46,569. Although China is the world’s second largest economy with a 2010 GDP of$10.8 trillion, it has a population of 1.3 billion people, so per capita GDP is only $8,125, a little bit less than South Africa ($8,907) and a little bit more than Tunisia ($7,531). Similarly, India has the third largest economy but, after China, it has the world’s second largest population, so GDP per capita in India is only $3,996.
TABLE 6.1 The 10 Largest Countries Ranked by GDP (2010)
|
|
Country |
GDP (billions of U.S. dollars) |
GDP per Capita (U.S. dollars) |
|---|---|---|---|
|
1 |
United States |
$14,447 |
$46,569 |
|
2 |
China |
$10,807 |
$8,125 |
|
3 |
India |
$4,687 |
$3,996 |
|
4 |
Japan |
$4,394 |
$34,655 |
|
5 |
Germany |
$3,126 |
$38,289 |
|
6 |
United Kingdom |
$2,398 |
$38,463 |
|
7 |
Russia |
$2,370 |
$17,005 |
|
8 |
France |
$2,281 |
$35,223 |
|
9 |
Brazil |
$1,962 |
$9,755 |
|
10 |
Italy |
$1,931 |
$31,779 |
|
Source: Penn World Tables. |
|||
96
Some poorer countries have grown considerably and have achieved a middle-income status between “rich” and “very poor.” Examples would be Mexico and Chile; their per capita GDPs are around $13,430 and $15,960, respectively. India and China are hoping to make similar gains.
Okay, we can see that GDP per capita gives us a rough guide to a country’s standard of living, but what is GDP actually measuring? In this chapter, we will explain:
 What the GDP statistic means and how it is measured
 The difference between the level of GDP and the growth rate of GDP
 The difference between nominal GDP and real GDP
 How growth in per capita real GDP is a standard measure of economic progress
 The use of GDP in business cycle measurement
 Problems with GDP as a measure of output and welfare
97