Producer Surplus
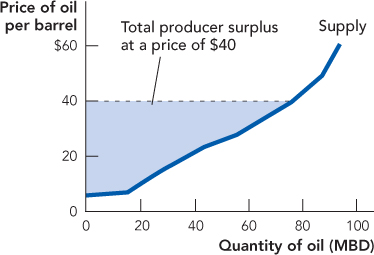
Figure 3.9 suggests two other concepts of importance. If the price of oil is $40 per barrel and Saudi Arabia can produce oil at $2 per barrel, then we say that Saudi Arabia earns a producer surplus of $38 per barrel. Similarly, if the price of oil is $40 per barrel and Nigeria can produce at $5 a barrel, Nigeria earns a producer surplus of $35 per barrel. Adding the producer surplus for each producer for each unit, we can find total producer surplus. Fortunately, this is easy to do on a diagram. Total producer surplus is the area above the supply curve and below the price (see Figure 3.10).

Producer surplus is the producer’s gain from exchange, or the difference between the market price and the minimum price at which a producer would be willing to sell a particular quantity.
Total producer surplus is measured by the area above the supply curve and below the price.
Consumer surplus measures the consumer’s benefit from trade, and producer surplus measures the producer’s benefit from trade. If we add the two surpluses together, we get a measure of the total gains from trade to market participants. All else equal, more benefits are better, so throughout this text, we will be using consumer plus producer surplus as a measure of welfare to compare different institutions and policies such as markets, monopolies, price controls, quotas, taxes and subsidies. Which of these institutions maximizes total benefits and under what conditions? Of course, sometimes not all else is equal, and in Chapter 10 on externalities and in Chapter 21 on ethics, we will be looking at situations where it’s important to add to our measure of benefits (and costs) to take into account the effect of trade on bystanders and on broader social interests.
37