6.1 CHAPTER REVIEW
FACTS AND TOOLS
Question 6.6
1. As we saw in Chapter 4, economists’ idea of equilibrium borrows a lot from physics. Let’s push the physics metaphors a bit further. Here, we focus just on the supply side. For each set of words in brackets, circle the correct choice:
When the government subsidizes an activity, resources such as labor, machines, and bank lending will tend to gravitate [toward/away from] the activity that is subsidized and will tend to gravitate [toward/away from] activity that is not subsidized.
When the government taxes an activity, resources such as labor, machines, and bank lending will tend to gravitate [toward/away from] the activity that is taxed and will tend to gravitate [toward/away from] activity that is not taxed.
Question 6.7
2. Junk food has often been criticized for being unhealthy and too cheap, enticing the poor to adopt unhealthy lifestyles. Suppose that the state of Oklakansas imposes a tax on junk food.
What needs to be true for the tax to actually deter people from eating junk food: Should junk food demand be elastic or should it be inelastic?
If the Oklakansas government wants to strongly discourage people from eating junk food, when will it need to set a higher tax rate: When junk food demand is elastic or when it is inelastic?
But hold on a moment: The supply side matters as well. If junk food supply is highly elastic—perhaps because it’s not that hard to start selling salads with lowfat dressing instead of mayonnaise- and cheese-laden burgers—does that mean that a junk food tax will have a bigger effect than if supply were inelastic? Or is it the other way around?
110
Let’s combine these stories now. If a government is hoping that a small tax can actually discourage a lot of junk food purchases, it should hope for:
Elastic supply and inelastic demand
Elastic supply and elastic demand
Inelastic supply and elastic demand
Inelastic supply and inelastic demand
Question 6.8
3. As we saw in the chapter, a lot turns on elasticity. Decades ago, Washington, D.C., a fairly small city, wanted to raise more revenue by increasing the gas tax. Washington, D.C., shares borders with Maryland and Virginia, and it’s very easy to cross the borders between these states without even really noticing: The suburbs just blend together.
How elastic is the demand for gasoline sold at stations within D.C.? In other words, if the price of gas in D.C. rises, but the price in Maryland and Virginia stays the same, will gasoline sales at D.C. stations fall a little, or will they fall a lot?
Take your answer in part a into account when answering this question. So, when Washington, D.C., increased its gasoline tax, how much revenue did it raise: Did it raise a little bit of revenue, or did it raise a lot of revenue?
How would your answer to part b change if D.C., Maryland, and Virginia all agreed to raise their gas tax simultaneously? These states have heavily populated borders with each other, but they don’t have any heavily populated borders with other states.
Question 6.9
4. In Figure 6.5, what is the total revenue raised by the tax, in dollars? What is the deadweight loss from the tax, in dollars? (Note: You’ve seen the formula for the latter before. We’ll let you look around a little for this one.)
Question 6.10
5.
Once again: Why does the text say that elaticity = escape? (This is worth remembering: Elasticity is one of the toughest ideas for most economics students.)
Which two groups of workers did we say have a relatively high elasticity of labor supply? Keep this in mind as politicians debate raising or lowering taxes on different types of workers: These two groups are the ones most likely to make big changes in their behavior.
Question 6.11
6. Suppose that Maria is willing to pay $40 for a haircut, and her stylist Juan is willing to accept as little as $25 for a haircut.
What possible prices for the haircut would be beneficial to both Maria and Juan? How much total surplus (that is, the sum of consumer and producer surplus) would be generated by this haircut?
If the state where Maria and Juan live instituted a tax on services that included a $5 per haircut tax on stylists and barbers, what happens to the range of haircut prices that benefit both Maria and Juan? Will the haircut still happen? Will this tax alter the total economic benefit of this haircut?
What if instead the tax was $20?
THINKING AND PROBLEM SOLVING
Question 6.12
1. Some people with diabetes absolutely need to take insulin on a regular basis to survive. Pharmaceutical companies that make insulin could find a lot of other ways to make some money.
If the U.S. government imposes a tax on insulin producers of $10 per cubic centimeter of insulin, payable every month to the U.S. Treasury, who will bear most of the burden of the tax: insulin producers or people with diabetes? Or can’t you tell with the information given?
Suppose instead that because of government corruption, the insulin manufacturers convince the U.S. government to pay the insulin makers $10 per cubic centimeter of insulin, payable every month from the U.S. Treasury. Who will get more of the benefit of this subsidy: insulin producers or people with diabetes? Or can’t you tell with the information given?
Question 6.13
2. Let’s see if we can formulate any real laws about the economics of taxation. Which of the follow ing must be true, as long as supply and demand curves have their normal shape (i.e., they aren’t perfectly vertical or horizontal, and demand curves have a negative slope while supply curves have a positive slope). More than one may be true.
If there is a tax:
111
The equilibrium quantity must fall, and the price that buyers pay must rise.
The equilibrium quantity must rise, and the price that sellers pay must rise.
The equilibrium quantity must fall, and the price that sellers receive must fall.
The equilibrium quantity must rise, and the price that buyers receive must fall.
(Note: The correct answer[s] to this question was [were] actually controversial until Nobel laureate Paul Samuelson created a simple mathematical proof in his legendary graduate textbook, Foundations of Economic Analysis.)
Question 6.14
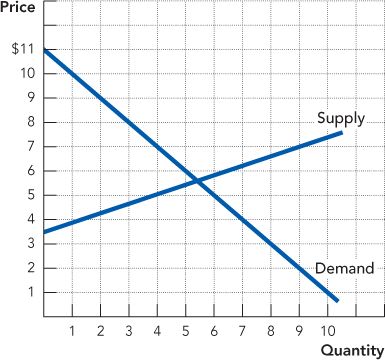
3. Using the following diagram, use the wedge shortcut to answer these questions:
If a tax of $2 were imposed, what price would buyers pay and what price would suppliers receive? How much revenue would be raised by the tax? How much deadweight loss would be created by the tax?
If a subsidy of $5 were imposed, what price would buyers pay and what price would suppliers receive? How much would the subsidy cost the government? How much deadweight loss would be created by the subsidy?
Question 6.15
4. When government is trying to raise tax revenue, it sometimes attempts to target higher-income people because they are in a better position to bear the burden of a tax. However, it can be very difficult to earn tax revenue from wealthy people.
Consider the progressive nature of the U.S. federal income tax system: It’s designed so that higher incomes are taxed at higher tax rates. Thinking about the elasticity of labor supply, why might it be more difficult to collect tax revenue from a wealthy individual than from a poor person, all else equal?
Another way governments have tried to collect taxes from the wealthy is through the use of luxury taxes, which are exactly what they sound like: taxes on goods that are considered luxuries, like jewelry or expensive cars and real estate. What is true about the demand for luxuries? Consider jewelry. Is a luxury tax more likely to hurt the buyers of jewelry or the sellers of jewelry?
The chapter began by discussing another tax that targets wealthy individuals: the estate tax. Comment on the effectiveness of this tax (in terms of government revenue), considering the demand of wealthy individuals for leaving an inheritance.
Question 6.16
5. As we learned in Chapter 4, the competitive market equilibrium maximizes gains from trade. Taxes and subsidies, by altering the market outcome, reduce the gains from trade. Does this happen primarily because of the impact of taxes and subsidies on prices or the impact of taxes and subsidies on quantities?
Question 6.17
6. Consider the following diagram of a tax. The triangular area representing deadweight loss is highlighted, and its dimensions are labeled “Base” and “Height” (recall that the formula for the area of a triangle is  × Base × Height).
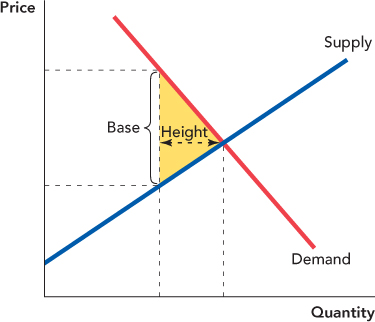
In order to calculate the deadweight loss of a tax, you don’t need the entire demand and supply diagram; you just need to know two numbers, the base and height of the deadweight loss triangle. What is the real-life meaning of the base? What about the height?
112
Can you turn your answers to part a into general rules about the deadweight loss associated with taxes? Try phrasing it like this but replacing the part in brackets: “The larger the [base or height], the more deadweight loss is generated by a given tax.”
Holding the base constant, the height and thus the deadweight loss would get larger if the demand curve or the supply curve were more ____________?
Without having a diagram as a reference, can you answer the preceding questions for a subsidy?
Question 6.18
7. Suppose your state government has decided to tax donuts. Currently, in your state, 300,000 donuts are sold every day. Three possible taxes are being considered by lawmakers: a 20-cent per donut tax, which would decrease donut sales by 50,000 per day; a 25-cent per donut tax, which would decrease donut sales by 100,000 per day; and a 50-cent per donut tax, which would decrease donut sales by 150,000 donuts per day.
Calculate the amount of tax revenue generated by each tax and the deadweight loss caused by each tax.
If the goal of your state government is simply to raise the most tax revenue, which tax is preferable?
If the goal of your state government is to raise tax revenue in the most efficient manner (with the least deadweight loss per dollar of revenue), which tax is preferable?
What other goal might your state government have when creating this kind of tax besides raising tax revenue?
Question 6.19
8. How is it that a tax creates a deadweight loss by decreasing quantity, but a subsidy creates a deadweight loss by increasing quantity?
CHALLENGES
Question 6.20
1. Let’s apply the economics of taxation to romantic relationships.
What does it mean to have an inelastic demand for your boyfriend or girlfriend? How about an elastic demand?
Sometimes relationships have taxes. Suppose that you and your boyfriend or girlfriend live one hour apart. Using the tools developed in the chapter, how can you predict which one of you will do most of the driving? That is, which one of you will bear the majority of the relationship tax?
Question 6.21
2.
In the opening scene of the classic Eddie Murphy comedy Beverly Hills Cop, Axel Foley, a Detroit police officer, is stopping a cigarette smuggling ring. Of course, smugglers don’t pay the tax when the cigarettes cross state lines. Which way do you suspect the smugglers were moving the cigarettes, based on economic theory? From the high-tax North to the low-cost South, or vice versa?
In our discussion of taxation, we’ve acted as if it were effortless to pass and enforce tax laws. But of course, law enforcement officials including the Internal Revenue Service put a lot of effort into enforcing tax laws. Let’s think for a moment about what kind of taxes are easiest to collect, just based on the basic ideas we’ve covered. Who will make the most effort to escape a tax: the party who is elastic or the party who is inelastic?
(Hint: It doesn’t matter whether we’re talking about suppliers or demanders.)
(Note: Public administration researchers know the most about this topic. Carolyn Webber and Aaron Wildavsky’s surprisingly enjoyable classic, A History of Taxation and Expenditure in the Western World, sets out just how difficult it’s been for most Western governments to collect taxes.)
Question 6.22
3. Let’s get some practice with the “wedge trick,” and use it to learn about the relationship between subsidies and lobbying. The U.S. government has many subsidies for alternative energy development: Some are just called subsidies; some are called tax breaks instead. Either way, they work just like the subsidies we studied in this chapter. We’ll look at the market for windmills.
In the two figures, one is a case where the sellers of windmills have an elastic supply and the buyers of windmills (local power companies) have inelastic demand. In the other case, the reverse is true. Which is which?
113
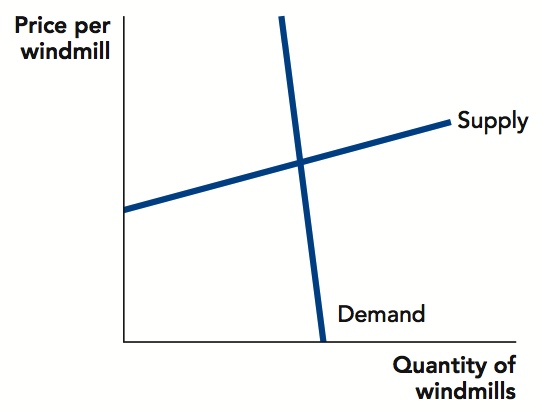
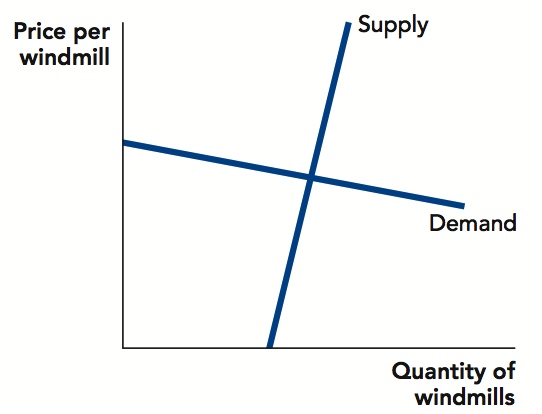
In which case will a subsidy cut the price paid by the buyers the most: When demand is elastic or when it is inelastic? (It’ll be easiest if you use the wedge trick.) Is this the first or second graph?
In which case will a subsidy increase the price received by the sellers more: When supply is elastic or when it is inelastic? Again, which graph is this?
Now look at how producer surplus and consumer surplus change in these two cases. To see this, remember that producer surplus is the area above the supply curve and below the price, and consumer surplus is the area below the demand curve and above the price. So in the first graph, who gets the lion’s share of any subsidy-driven extra surplus: suppliers or demanders? Is that the inelastic group or the elastic group? In other words, whose surplus triangle gets bigger faster as the quantity increases? (You might try shading in these triangles just to be sure.)
Now it’s time for the second graph. Again, who gets the lion’s share of any subsidy-driven extra surplus: suppliers or demanders? Is that the inelastic group or the elastic group?
There’s going to be a pattern here in parts d and e: The more [elastic or inelastic?] side of the market gets more of the extra surplus from the subsidy.
When Congress gives subsidies for the alternative energy market, it is hoping that a small subsidy can get a big increase in output: In other words, they are hoping that the equilibrium quantity will be elastic. At the same time, the groups most likely to lobby Congress for a big alternative energy subsidy are going to be the groups that get the most extra surplus from any subsidy. After all, if the subsidy doesn’t give them much surplus, they’re not likely to ask Congress for it.
So here’s the big question: Will the groups that are most likely to lobby for a subsidy be the same groups that are most likely to respond to the subsidy? (Note: This is a general lesson about the incentives for lobbying: It’s not just a story about the alternative energy industry.)
Question 6.23
4. As you learned in the chapter, the elasticities of demand and supply are crucial in determining how the burden of a tax (or the benefit of a subsidy) is divided between buyers and sellers. Under what conditions for supply or demand would a seller actually be able to avoid bearing any of the burden of a tax? Under what conditions would a subsidy benefit only the sellers of a good?
Question 6.24
5. In the chapter, most of the taxes we discussed were equal to a certain dollar amount per unit. In this case, a tax on sellers results in a parallel upward shift of the supply curve; a tax on buyers results in a parallel downward shift of the demand curve. In reality, however, many taxes are expressed as a percentage. Graphically, how would you show a 100% tax on the sellers of a good? How would you show a 100% tax on the buyers of a good? One of the results of this chapter is that it doesn’t matter on whom the tax is levied; the result is the same. Show graphically that this also applies to percentage taxes.
114
!launch! WORK IT OUT
Consider the following supply and demand diagram. In this market, the government subsidizes the production of this good, and the subsidy wedge is indicated.
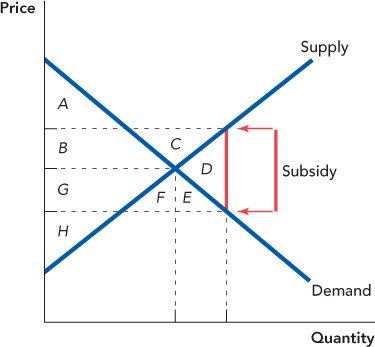
Without the subsidy, which area(s) represent(s) the total gains from trade?
After the subsidy, which area(s) represent(s) consumer surplus? Which area(s) represent(s) producer surplus? Which area(s) represent(s) total government spending on this subsidy?
Which area(s) in part b showed up in the answer to more than one of the questions? Can you explain this?