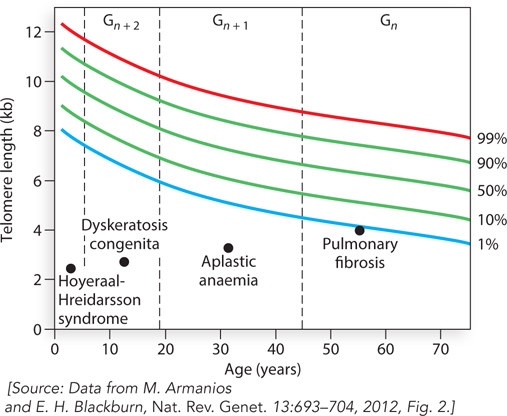
FIGURE 1 The association between dysfunctional telomeres and age-related diseases. The lines represent changes in typical percentage telomere length with age in lymphocytes. With age, telomere length decreases. The percentage normal distribution of telomere length among humans is given on the right. The red dots indicate the telomere length at the given age for four different telomere-related genetic diseases. The vertical dashed lines, Gn, Gn+1 and Gn+2, designate three successive generations, revealing that the onset of the disease occurs earlier in life with each generation.