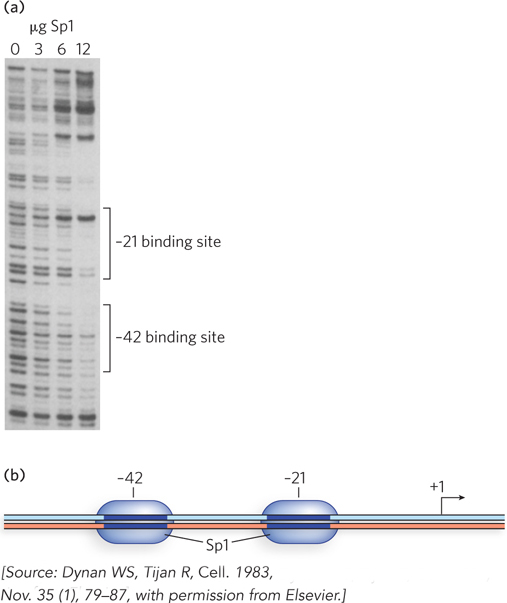
FIGURE 2 Sp1 leaves its footprint on a promoter. (a) The Sp1 footprint, seen as bands in the gel that decrease in intensity as the Sp1 concentration increases, is visible at sites flanking positions −21 and −42 with increasing concentrations of Sp1. The band that increases in intensity indicates a base pair in the DNA that becomes more susceptible to cleavage by DNase I on Sp1 binding—