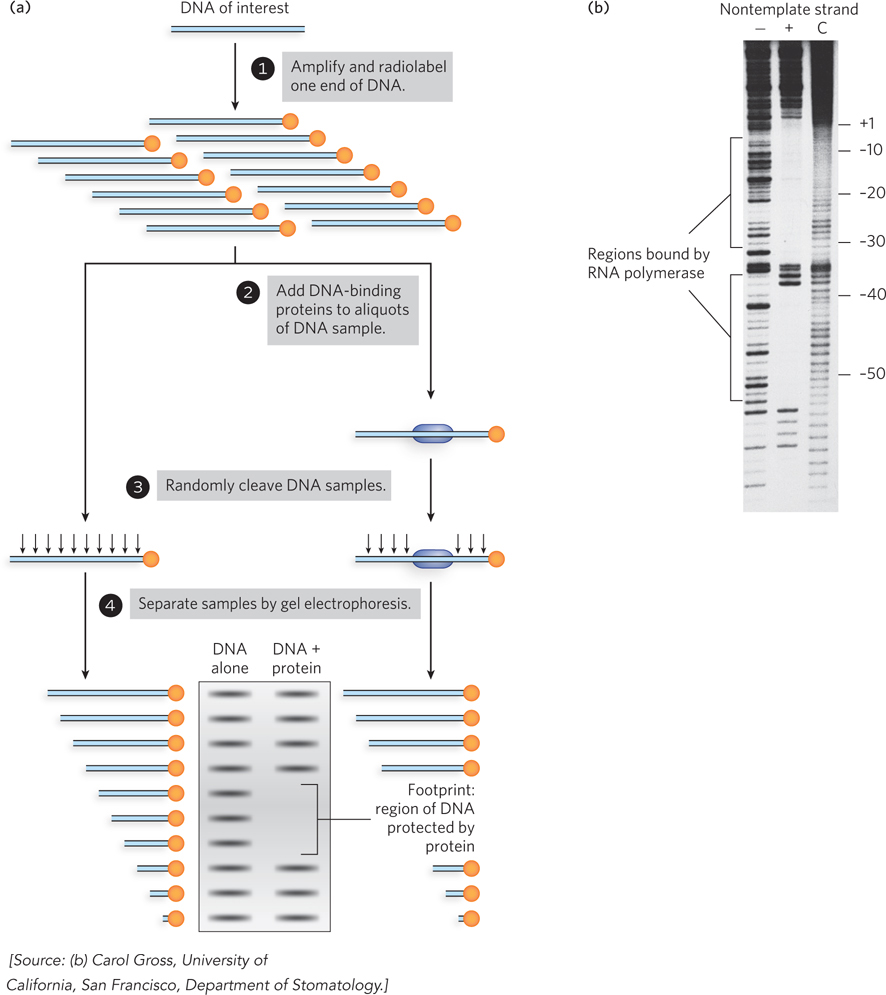
FIGURE 2 (a) DNA footprinting analysis reveals a protein’s binding site on a DNA fragment. (b) In this example, the binding site of RNA polymerase at the Lac promoter is determined using DNase to digest the lac DNA wherever the polymerase is not directly binding it and protecting it. The lanes show no polymerase added (−), polymerase added (+), and the control reaction with no DNase added (C). The upstream sites are indicated to the right of the gel.