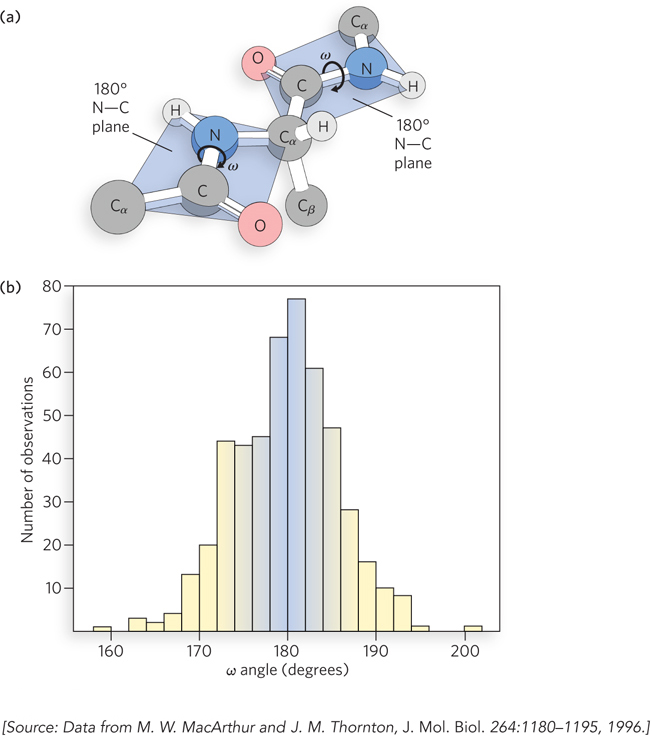
FIGURE 2 Peptide bond rotational energies and the distribution of angular frequencies. (a) The angle ω represents the rotation of a bonded atom about the peptide bond; 1808 is planar, because the bonded atoms point to opposite corners of a (planar) rectangle. (b) This histogram represents the angular frequency distribution of ~200,000 ω values obtained from coiled regions of ~4,000 high- 4-