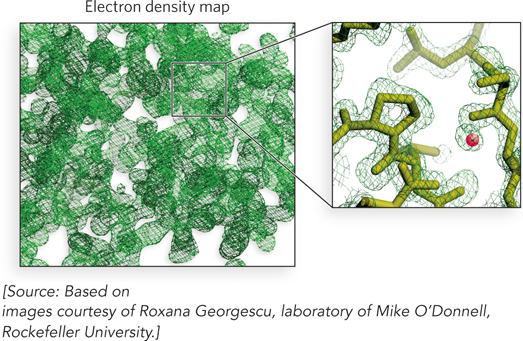
An electron density map. An electron density map (left) contains too much information to analyze when viewed all at once. The experimenter focuses instead on one small region at a time (right) and fits the polypeptide backbone into the density. Shown here are molecules that lie in the outlined portion of the electron density map. The small red sphere is an ordered water molecule—