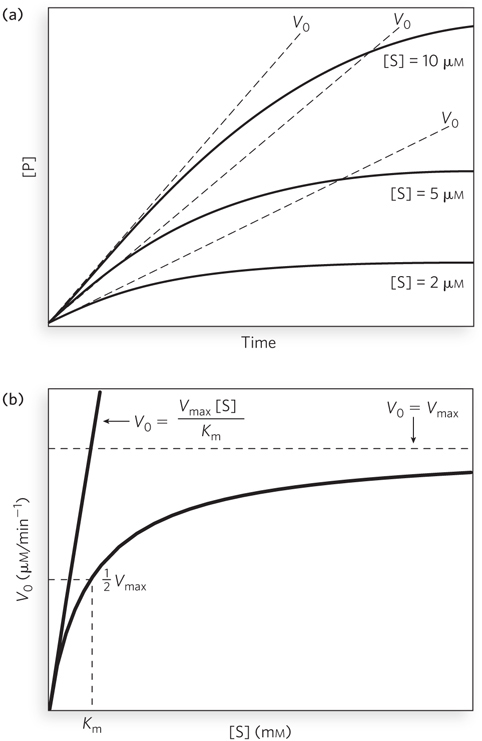
The initial velocity of an enzyme-catalyzed reaction. (a) A theoretical enzyme catalyzes the reaction S ⇌ P. Progress curves for the reaction (product concentration, [P], vs. time) measured at three different initial substrate concentrations ([S]) show that the rate of the reaction declines as substrate is converted to product. A tangent to each curve taken at time zero (dashed lines) defines the initial velocity, V0, of the reaction. (b) The maximum velocity, Vmax, is indicated as a horizontal dashed line. The straight solid line describes the linear dependence of the initial velocity, V0, on [S] at low substrate concentrations. However, as [S] increases, the line in reality becomes nonlinear, as depicted by the curved line. V0 approaches but never quite reaches Vmax. The substrate concentration at which V0 is half maximal is Km, the Michaelis constant. The concentration of enzyme in an experiment such as this is generally so low that [S] ≫ [E] even when [S] is described as low or relatively low. At low [S], the slope of the line is defined by V0 = Vmax[S]/Km, and this is where V0 exhibits a linear dependence on [S]. The units shown here are typical for enzyme-catalyzed reactions and help illustrate the meaning of V0 and [S]. (Note that the curved line describes part of a rectangular hyperbola, with one asymptote at Vmax. If the curve were continued below [S] = 0, it would approach a vertical asymptote at [S] = −Km.)