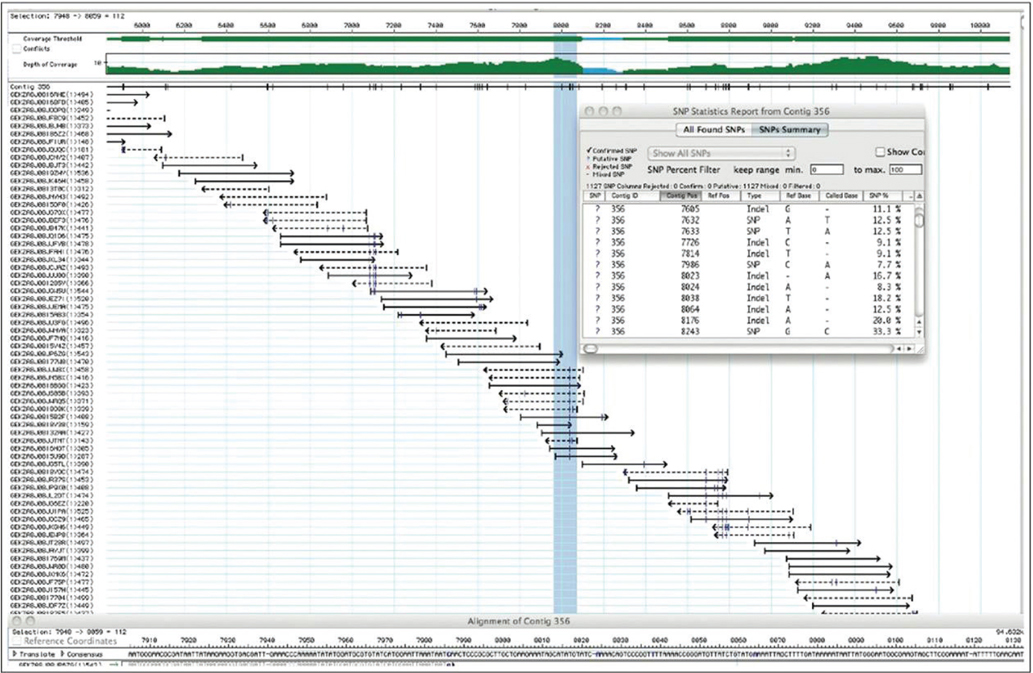
Sequence assembly. In a genomic sequence, each base pair of the genome is usually represented in many of the sequenced fragments, referred to as reads. Shown is a small part of the sequence of a new variant species of E. coli, with the reads generated by a 454 sequencer. The numbers at the top represent genomic base-pair positions, relative to an arbitrarily defined “0.” The sequences all come from a particular long contig designated 356. The reads themselves are represented by horizontal arrows, with computer-assigned identifiers listed for each one at the left. DNA strand segments are sequenced at random, with sequences obtained from one strand (5′ to 3′, left to right) represented by solid arrows and sequences obtained from the other strand (5′ to 3′, right to left) represented by dashed arrows. The latter sequences are automatically reported as their complement when they are merged with the overall dataset. The “coverage threshold” at the top is a measure of sequence quality. The wider green bar indicates sequences that have been obtained enough times to generate high confidence in the results. The depth of the coverage line indicates how many times a given base pair appears in a sequenced read. The vertical blue shaded line indicates a part of the sequence that is highlighted by thin blue brackets in the sequence line at the bottom of the page. The “SNP statistics report” (inset) is a listing of positions where single nucleotide polymorphisms (SNPs; see Chapter 8) appear to be present in some of the reads. These putative SNPs are often checked by additional sequencing. They are indicated in the reads by thin, blue vertical slash marks within the horizontal lines for each read.