2.3 THE CHROMOSOME THEORY OF INHERITANCE
Walter Sutton’s studies on chromosomes were performed just as Mendel’s work was being rediscovered. Sutton found himself at a remarkable intersection of two fields: cytology and genetics. He made the connection between chromosomes and Mendel’s particles of heredity in his classic 1903 paper “The Chromosomes in Heredity” (see the How We Know section at the end of this chapter). He proposed that chromosomes contain Mendel’s particles of heredity and that the particles come in pairs: chromosomes exist as homologous pairs in diploid cells. Mendel’s particles—gene pairs—separate and assort independently into gamete cells; homologous chromosome pairs also separate and assort into haploid gamete cells.
Sutton’s hypothesis that genes are located on chromosomes received much attention and became known as the chromosome theory of inheritance. But there was still no proof that genes were actually on chromosomes. This would be left for Thomas Hunt Morgan and his students to establish in their classic studies of fruit flies. Interestingly, Morgan did not initially believe in the chromosome theory of inheritance. But his experiments would inevitably lead him to this conclusion, and his name would become as linked to the chromosome theory as are genes themselves.
Sex-Linked Genes in the Fruit Fly Reveal That Genes Are on Chromosomes
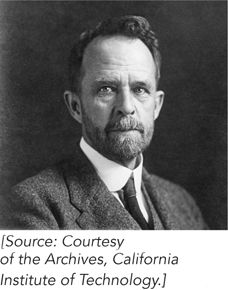
Thomas Hunt Morgan, 1866–1945
In 1908, Morgan initiated his studies of the fruit fly, Drosophila melanogaster (see the Model Organisms Appendix). In those days, it was essential to keep costs to a minimum, as funding for science was scarce. The fruit fly is small; it could be grown in large numbers and was inexpensive to maintain. Flies also have an array of phenotypic features suitable for genetic studies, and they have just four homologous pairs of chromosomes that can be visualized under the microscope. Most important of all, the generation time of the fly is less than 2 weeks, and each female can lay hundreds of eggs. These features made fruit flies far superior to other model organisms of the day.
Morgan’s famous Fly Room at Columbia University was small and cramped, but conducive to science; several of his students became famous for their discoveries in genetics. In 1910, Morgan noticed a male fly with white eyes that spontaneously appeared in a bottle of red-eyed flies. He immediately set up crosses to determine whether the white-eye trait was inheritable. It was, but in an unusual way. Figure 2-14 shows Morgan’s first experiment. Normal flies have red eyes, straight wings, and a gray body, referred to as wild-type traits.
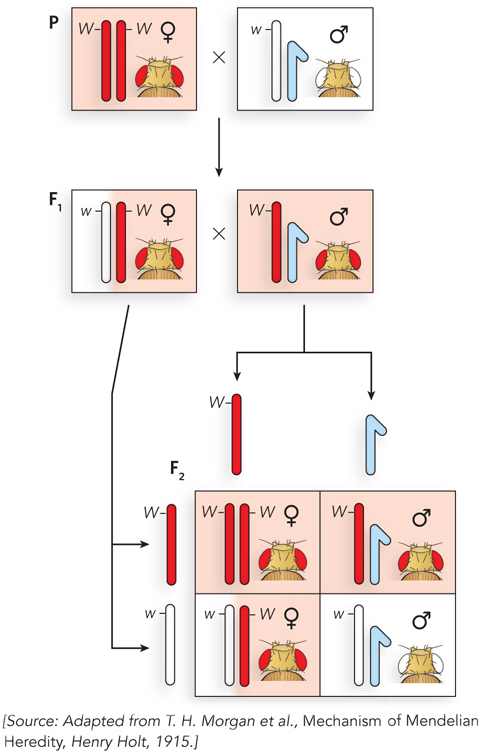
Figure 2-14: X-linkage of the white-eye allele. Results of a cross between a red-eyed female and a white-eyed male fly. F1 flies are red-eyed. The white-eye trait reappears in the F2 generation. Only males in the F2 generation have white eyes. Morgan realized that these results make sense if the white-eye allele is located on the X chromosome.
KEY CONVENTION
The allele that appears with the greatest frequency in a natural population of a species is called the wild-type allele. All other alleles are mutants. Wild-type alleles can be dominant or recessive to a mutant allele.
Morgan crossed a red-eyed female with the mutant white-eyed male. All the F1 hybrid progeny had red eyes, the wild-type phenotype. This told Morgan that the allele for red eyes is dominant to the allele for white eyes. His next cross, an F1 female with an F1 male, produced some F2 progeny with white eyes—the expected result for a typical recessive allele. But surprisingly, all the white-eyed flies were male. All the F2 females had red eyes, and about half the F2 males had red eyes. It seemed that the trait for white eyes was somehow connected to sex. Morgan performed a variety of additional crosses and found, again to his surprise, that the white-eye trait mirrors the segregation behavior of the X chromosome (see Figure 2-14). Morgan’s findings, linking a genetic trait to a particular chromosome, were convincing evidence that genes are located on chromosomes.
The alleles for this eye-color gene can be represented as XW for red-eyed and Xw for white-eyed. In this genetic nomenclature, the X represents the X chromosome, and a superscript W is used for the dominant red-eye allele and a superscript w for the recessive white-eye allele. The letters R and r (for red and white, respectively), which might be expected from the convention introduced earlier in the chapter, are not used in this case because there are many different mutant alleles that affect eye color. There is only one wild-type color, so the wild-type and different mutant alleles are named according to the different mutant colors.
Further evidence that genes are located on chromosomes came from Calvin Bridges, an associate in Morgan’s laboratory. Bridges hypothesized that if genes are located on chromosomes, then some genetic anomalies should also produce visible abnormalities in the chromosomes themselves. Bridges crossed white-eyed female flies (XwXw) with red-eyed males (XWY) that he had in his fly collection. Most progeny were the expected white-eyed males and red-eyed females. However, Bridges noticed a few rare (<0.1%) white-eyed females and red-eyed males, which he called “primary exceptionals.” Bridges made the unusual prediction that if genes are truly on chromosomes, then primary exceptional flies will have an abnormal chromosome number. He reasoned that the primary exceptional phenotype might be explained by defective meiosis in the female parent, in which X chromosomes did not separate, so producing an egg with two X chromosomes and an egg with no X chromosome (Figure 2-15a). Thus, exceptional white-eyed females, which must have two Xw chromosomes, received them from the abnormal XwXw egg, plus a Y chromosome from the sperm, for a genotype of XwXwY (note that an XW sperm would bring in a dominant red-eye gene) (Figure 2-15b). By similar reasoning, the exceptional red-eyed male originated from fertilization of the abnormal egg having no X chromosome by a sperm containing a single XW chromosome, for a genotype of XWO. Note that although flies (like mammals) have X and Y chromosomes, sex in D.melanogaster is determined by the number of copies of the X chromosome, not by the presence or absence of the Y chromosome. Thus, an XXY fly is female and an XO fly is male.
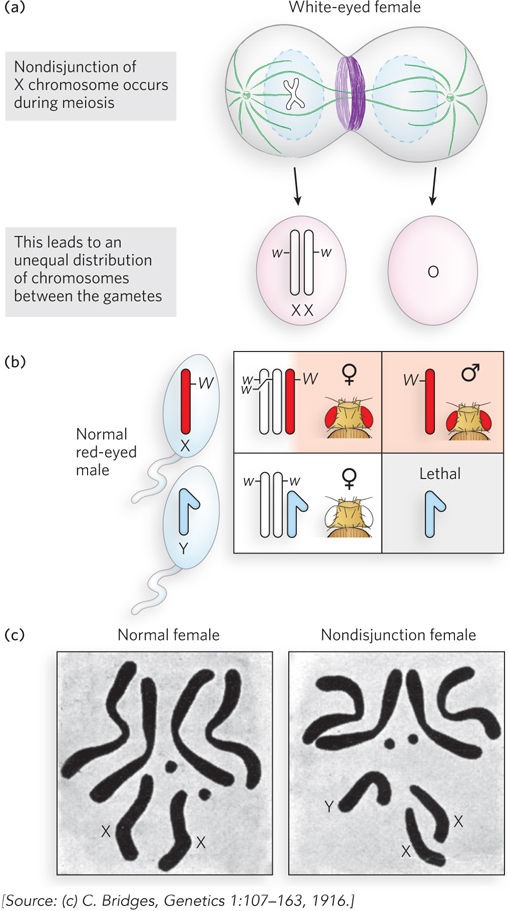
Figure 2-15: Nondisjunction. A rare occurrence during meiosis, nondisjunction produces gametes that have either one extra chromosome or one fewer chromosome. (a) Nondisjunction of the X chromosome is shown here; the white-eye allele is on the X chromosome. (b) Fertilization with normal sperm produces adult flies with odd numbers of chromosomes, as illustrated in the Punnett square. (c) Bridges predicted the occurrence of nondisjunction to explain rare progeny phenotypes, and cytologic examination of chromosomes in the rare progeny confirmed the predicted extra Y chromosome in a white-eyed female.
When Bridges examined the chromosomes of primary exceptional flies, the results followed his predictions precisely (Figure 2-15c). His study was an impressive demonstration that genes are located on chromosomes, because, to explain the genetic results, he had hypothesized highly unusual outcomes that could be verified by examining the chromosomes directly. This abnormal assortment of chromosomes during meiosis is called nondisjunction.
Linked Genes Do Not Segregate Independently
Chromosomes, not individual genes, segregate into gamete cells, so one might expect two different genes on the same chromosome to stay together during meiosis and thus to be inherited together (i.e., they would not obey Mendel’s second law). Take, for example, two genes, A and B, on the same chromosome. A cross of AABB and aabb parents will produce the AaBb F1 hybrid, but particular combinations of alleles (A, B and a, b) are linked on the same chromosome. Therefore, the F1 hybrid can produce only two types of gametes, AB and ab, rather than all four possible gametes produced if the genes separated and assorted randomly—AB, Ab, aB, ab.
To determine the genotype of an F1 hybrid experimentally, it is crossed with a strain that is homozygous recessive (aabb), and the progeny reveal both the recessive and dominant alleles of the F1 gametes. Such a cross is known as a testcross. If the two genes separate in the gametes of the F1 hybrid, the F2 generation will exhibit all four possible phenotypes. If the two genes are linked, the F1 hybrid will produce only two types of gametes (AB and ab) and the F2 generation will display only the two parental phenotypes (Figure 2-16).
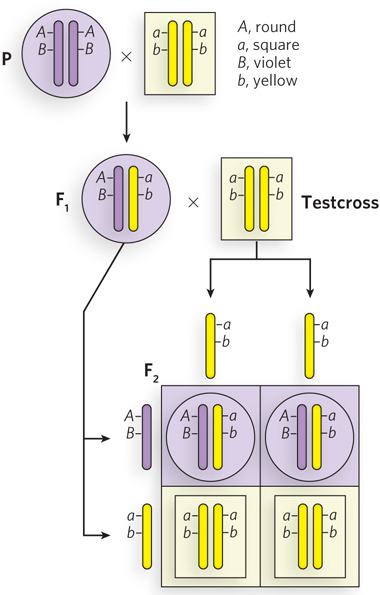
Figure 2-16: The inheritance of linked genes. Linked genes segregate together because they are on the same chromosome—that is, they are part of the same DNA molecule. In this hypothetical example, the dominant and recessive genes and their phenotypes are: A, round; a, square; B, violet; b, yellow. The cross between homozygous dominant and homozygous recessive parents produces F1 AaBb progeny with linked alleles A, B and a, b. A testcross with a double-recessive homozygous individual (aabb) reveals the genotypes of the gametes produced by the F1 progeny. The Punnett square shows the expected results for completely linked genes. The F1 generation can produce only AB and ab gametes, and thus only two types of F2 progeny are observed; they have the same phenotype as the original P generation.
An example of linked genes in Drosophila is illustrated in Figure 2-17, for a body-color gene with alleles b (black body) and B (gray body), and a wing-shape gene with alleles v (vestigial wings) and V (long wings). Consider the parental cross BBvv (gray body, vestigial wings) x bbVV (black body, long wings). All F1 progeny (BbVv) have a gray body and long wings. To determine whether the two genes are linked, a testcross is performed between an F1 fly and a double-recessive bbvv fly. The F2 progeny are mainly of two types and exhibit the same characteristics as the P generation (gray body, vestigial wings; black body, long wings). Thus, the two genes are linked. Had the genes assorted completely independently, mixed phenotypes would have been observed in the F2 generation (black body, vestigial wings; gray body, long wings) in amounts equal to the parental phenotypes.
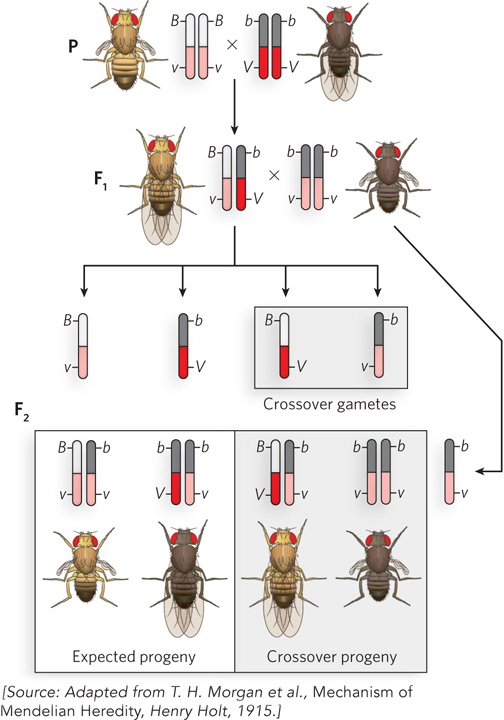
Figure 2-17: Unlinking genes by crossing over. Linked genes can become unlinked by chromosome recombination, or crossing over, during meiosis. The chromosomes containing the linked genes are illustrated in diploid cells and in gametes. To analyze gametes produced by F1 flies, the F1 hybrid is crossed with a double-recessive fly of genotype bbvv. In the F1 gametes, B and v are linked, and b and V are linked, so all F2 progeny are expected to contain these same two combinations. The double-recessive fly always contributes a bv gamete. But, in fact, four types of F2 progeny are observed: two are the expected phenotypes; the other two contain b, v and B, V, resulting from gametes in which the linked alleles were unlinked by recombination during meiosis. The two crossover phenotypes are produced at equal frequency (17% each).
The results of the experiment, however, do not show complete gene linkage. There are some F2 generation flies with mixed phenotypes, indicating that linked genes sometimes unlink. How can this happen—how do linked genes become unlinked?
Recombination Unlinks Alleles
Morgan noticed that linked genes do not always stay linked, but instead show a low, though reproducible, frequency of separating. Take, for example, the cross of flies with linked genes shown in Figure 2-17. Linked genes should give only parental phenotypes in the F2 progeny, yet a low frequency of mixed-phenotype F2 progeny was observed. These recombinant flies could be produced only if the linked genes were unlinked and separated during gamete formation. Both possible types of mixed-phenotype recombinant flies were produced (black body, vestigial wings; gray body, long wings) and appeared with equal frequency: each was 17% of the total F2 population.
To explain how linked genes become unlinked, and why they produce equal amounts of the two mixed phenotypes, Morgan hypothesized that one of the linked alleles on one chromosome (e.g., the long-wing allele) trades places with the homologous allele (vestigial-wing allele) on the homologous chromosome (Figure 2-18). In other words, genes hop from one homologous chromosome to the other and do so in a reciprocal fashion. This reciprocal exchange of alleles between chromosomes is called recombination, or crossing over.
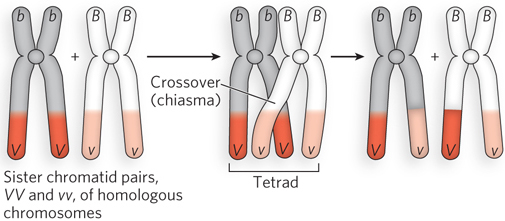
Figure 2-18: Crossing over in the tetrad. Two homologous chromosomes are duplicated in S phase to produce two sister chromatid pairs (left), one homozygous VV and the other homozygous vv. The sister chromatid pairs are homologous to each other, and they pair to form a tetrad in prophase I of meiosis, before the first cell division (middle). Recombination—as evidenced by the exchange of V and v alleles—occurs at crossovers, or chiasmata, the sites where chromosomes intertwine, resulting in genetic exchange between the two chromosomes of the sister chromatid pairs (right).
The idea that chromosomes exchange genetic material had been suggested earlier, in cytological studies by F. A. Janssens in 1909. Janssens noticed that during meiosis, the four chromosomes of the tetrad coil around one another and form cross-shaped junctions, which he called chiasmata (see Figure 2-18). He proposed that, as the mechanical forces pull the sister chromatid pairs apart during the first division of meiosis, the intertwined chromosomes break at the same place and then rejoin, but with the opposite chromosome. The first experimental proof that genetic crossing over is mediated by physical recombination between two chromosomes came from a study of corn by Barbara McClintock and Harriet Creighton (see the How We Know section at the end of this chapter).
We now know that recombination events are mediated by specialized proteins that catalyze DNA breakage and rejoining within homologous chromosomes of the tetrad. Crossing over is a frequent event during meiosis (Figure 2-19), occurring at least once in each tetrad. It is thought that meiotic recombination was selected for during evolution because it helps generate diversity within a species. Homologous recombination is discussed in detail in Chapter 13.
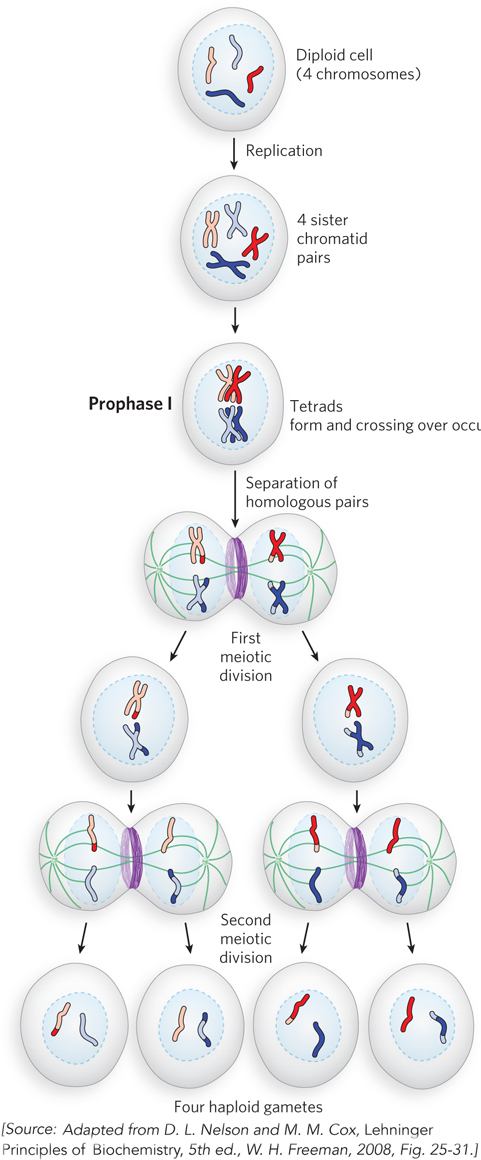
Figure 2-19: Recombination during meiosis. The chromosomes of a diploid cell (four chromosomes, two homologous pairs, are shown here) replicate, and each pair is held together at the centromere, forming four sister chromatid pairs. In prophase I, at the start of the first meiotic division, the two homologous sets of sister chromatid pairs align to form tetrads. Crossovers occur within the tetrads. In the first meiotic division, homologous pairs of chromosomes segregate into daughter cells. Each sister chromatid pair then lines up in preparation for the second meiotic division, which produces four haploid gamete cells. Each gamete has two chromosomes, half the number of the diploid cell.
Recombination Frequency Can Be Used to Map Genes along Chromosomes
Different pairs of linked genes exhibit different frequencies of crossing over, but the frequency is constant for a given pair of genes. Alfred Sturtevant, a student of Morgan’s, rationalized this observation by assuming that the frequency of crossing over corresponds to the distance between the two linked genes. He reasoned that the greater the distance, the more room there is for recombination to occur, thereby allowing linked genes to separate with greater frequency. With this logic, he used the frequency of crossing over to map the relative positions of pairs of linked genes along Drosophila chromosomes (Figure 2-20). Genetic map units, calculated from the frequency of crossing over, are called centimorgans (cM) in honor of Thomas Hunt Morgan; however, they do not necessarily reflect accurate physical distances between genes. Some regions of chromosomes tend to promote recombination, giving the impression that genes are farther apart than they really are; conversely, other regions repress crossing over, and genes seem to be closer than they are. The accuracy of genetic map distances is also limited by one crossing-over event interfering with another. However, recombination frequencies do provide useful genetic maps, because the data reveal the linear order of genes along a chromosome and provide a first approximation of the distance between them.
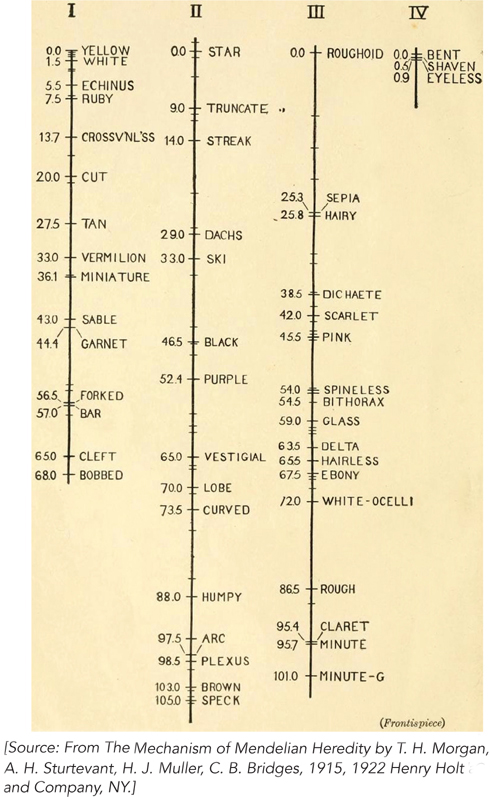
Figure 2-20: Using recombination frequency to create genetic maps. Sturtevant created genetic maps showing the positions of genes along the four Drosophila chromosomes, based on the frequency of crossing over between many pairs of linked genes. Linked genes fall into four groups, corresponding to the four different chromosomes in Drosophila, represented here by the vertical lines. Numbers on the left side of each chromosome are genetic map units, in centimorgans. Along the right side are the names of mutant alleles used in the crosses.
An example of recombination mapping is illustrated in Figure 2-21 for linked genes A, B, and C. Consider the frequency of crossing over of the linked gene pair A and B in fruit flies (Figure 2-21a). A parent homozygous for dominant alleles is crossed with a double-recessive fly (AABB × aabb), and the frequency of crossing over (the frequency of production of Ab and aB gametes by the F1 flies) is determined from the percentage of recombinant F2 progeny (Aabb and aaBb). This is repeated for the A, C pair and B, C pair. The results are shown in Figure 2-21b.
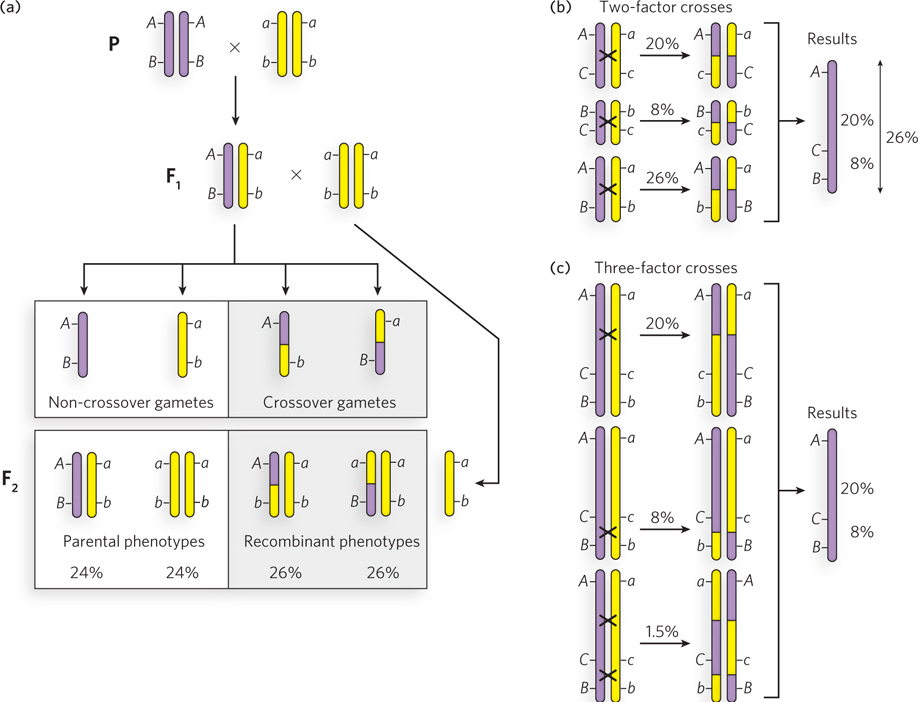
Figure 2-21: Recombination mapping. (a) The procedure for analyzing a two-factor cross. Diploid cells and gametes are illustrated to show the origin of recombinant F2 progeny. Chromosomes with dominant linked genes are purple; chromosomes with recessive linked genes are yellow. Crossing over results in purple-and-yellow hybrid chromosomes. F1 progeny are crossed with a homozygous double-recessive fly to analyze the genotypes of gametes produced by the F1 hybrid. (b) Analysis of linked genes using three two-factor crosses. Crossing over is indicated by x between two chromosomes. (c) Analysis of linked genes using three three-factor crosses. Two- and three-factor crosses lead to the same conclusion about gene order (ACB).
The greater frequency of recombinants for the A, B pair than for the A, C pair indicates that genes A and B are farther apart than genes A and C. However, gene C could be between A and B or on the opposite side of A from B. The frequency of crossing over of the B, C pair resolves the ambiguity: C is between A and B.
The frequency of recombinants for the A, B pair (26%) is somewhat less than the added frequencies of recombinants for the B, C pair and C, A pair (28%). This is because the probability of multiple crossing-over events between linked genes is higher the farther they are apart. For example, a single crossover unlinks the genes, but a second crossover links them again. Therefore, an odd number of crossovers will unlink genes, and an even number of crossovers relinks them, resulting in a maximum frequency of recombination of 50%. The frequency of independent assortment of genes on different chromosomes is also 50%, because there is a 50:50 chance that two chromosomes will segregate together into the same gamete. Because crossing over is a frequent occurrence in meiosis, genes on the same chromosome often assort independently. Therefore, recombination mapping is accurate only for pairs of linked genes that are close together.
Analysis of three genes in a single experiment, known as a three-factor cross, provides a convenient method to identify or confirm their order along the chromosome. To illustrate this, consider a three-factor cross between genes A, B, and C (Figure 2-21c). A fly that is homozygous dominant for three linked genes is crossed with a fly that is double recessive for all three genes. The F1 progeny (AaBbCc) are then crossed with a fly that is double recessive for all three genes. Most F2 progeny exhibit the parental phenotypes, but crossing over will produce six possible recombinants: three recombinants containing two dominant traits and three reciprocal recombinants containing one dominant trait. If the gene order is ACB, generation of the AcB and aCb recombinants requires two crossover events—one between A and C, and another between C and B. The aCB (and Acb) or ACb (and acB) recombinants each require only one crossover. Because a double crossover is much less frequent than a single crossover, the far lower frequency of the double crossover (1.5% in this example, yielding AcB and aCb) reveals which gene (C in this case) is between the other two.
SECTION 2.3 SUMMARY
Direct evidence that genes are located on chromosomes came from intensive studies of the fruit fly, Drosophila melanogaster, by Thomas Hunt Morgan. Segregation of the white-eye mutant allele with the X chromosome suggested that genes are associated with chromosomes.
Calvin Bridges’s correlation of mutant genes with chromosome abnormalities showed definitively that genes are located on chromosomes.
Linked genes, genes on the same chromosome, violate Mendel’s second law and assort together into gametes. However, linked genes must be close together on the chromosome to stay linked. The farther apart they are, the more likely they are to be separated by recombination during meiosis.
Recombination frequency can be used to map the relative positions of genes along a chromosome.