8.2 TRANSCRIPTOMES AND PROTEOMES
A gene is not simply a DNA sequence; it is information that is converted into a useful product—a protein or functional RNA molecule—when and if needed by the cell. We now turn to methods that contribute to our understanding of the functions of these gene products. The methods can be applied to efforts to study the response of a cell or organism to particular events or changes in the environment. They can also be used to help identify the functions of the many genes in every genome for which we know very little about their roles in the cell.
The study of complex interconnected processes in biology is called systems biology. Genome sequencing contributes to systems biology by providing information about all the genes in an organism. The methods we now address contribute more directly—by examining the expression of genes or the interactions of many kinds of proteins under specified sets of conditions. Many of the methods are described in Chapter 7. Here, we focus on increasingly complex problems in cellular metabolism.
Special Cellular Functions Are Revealed in a Cell’s Transcriptome
Only a subset of the many genes in a genome is expressed in any given cell. That subset may change in response to changes in the cellular environment or to extracellular signals of many kinds. The genes expressed in a cell under a given set of conditions constitute its transcriptome. Studies of the transcriptome, carried out by researchers in the subdiscipline of transcriptomics, can help reveal new cellular processes, as well as identify the genes and gene products involved in known processes. If the function of a gene is not known, an understanding of the circumstances that result in expression of that gene can provide an important functional clue.
Transcriptome analysis was first made practical with the advent of microarray technologies (see Figure 7-31). Microarrays can reveal, for example, the genes that are newly induced when a cell is subjected to heat shock, variations in expression patterns in different regions of a mammalian brain, or changes that occur when a pathogenic bacterium invades a host organism. The growing use of microarray-based transcriptome analysis has led to the development of online databases, some specific to a single organism, that make data available to the entire scientific community. As the quality of transcriptome data improves, the transcriptomes themselves become more than a list of expressed genes. They are also a kind of fingerprint that characterizes a class of cell under a given set of conditions. These databases are becoming very useful not only in basic research but in medicine as well.
For instance, the cells making up a tumor exhibit characteristic patterns of gene expression—a transcriptional profile—that may differ greatly from one tumor to the next. These profiles can provide a kind of tumor fingerprint, which can be used to predict a patient’s prognosis and/or select the most beneficial therapies. The value of these tools to oncologists and patients will only increase as the technologies become more widespread.
Recent progress in the diagnosis and treatment of breast cancer illustrates the potential of the technology. Broad clinical studies over the past decade have used microarrays to develop transcriptional profiles of thousands of breast cancers. Treatment protocols have been tracked, and the successes and failures carefully documented. Researchers are gradually identifying specific genes and groups of genes that, when expressed at higher levels and in certain combinations, serve as prognostic indicators. The result is a growing database of correlations that allows the use of transcriptional profiles to develop both prognoses and treatments.
High-Throughput DNA Sequencing Is Used in Transcriptome Analysis
Microarrays have some disadvantages for transcriptome analysis. They can provide inaccurate information about relative levels of transcription for genes that are expressed at very low or very high levels. In addition, they can miss any RNAs that are not homologous to genes included on the microarray. A newer method, called RNA-Seq, has been developed to address these shortcomings, taking advantage of modern, high-throughput DNA sequencing technologies (see Section 7.2).
A typical RNA-Seq experiment is shown in Figure 8-12. RNA is isolated from the cell or tissue to be analyzed. In most cells, rRNA is by far the most abundant RNA, but it is usually other types of RNA that are of most interest. Thus, most protocols include a step involving subtractive hybridization of the rRNA, using complementary probes that allow removal of the hybridized material. The remaining RNA is then converted to cDNA with the enzyme reverse transcriptase (see Figure 7-8). The cDNA is fragmented (e.g., by shearing or nuclease digestion) to an appropriate average length. Short adapter DNA segments that provide target sequences for the primers needed for DNA sequencing are ligated to both ends. Each cDNA is then “read” by DNA sequencing. Huge numbers of these short sequencing reads (typically 30 to several hundred base pairs, depending on the sequencing technology used) are produced. The gene from which each sequencing read is derived is determined by computerized alignment with the same sequence in the relevant genome database. Genes expressed at high or low levels are represented by correspondingly high or low levels of sequence reads. Gene expression levels can be mapped across genes, chromosomes, and entire genomes.
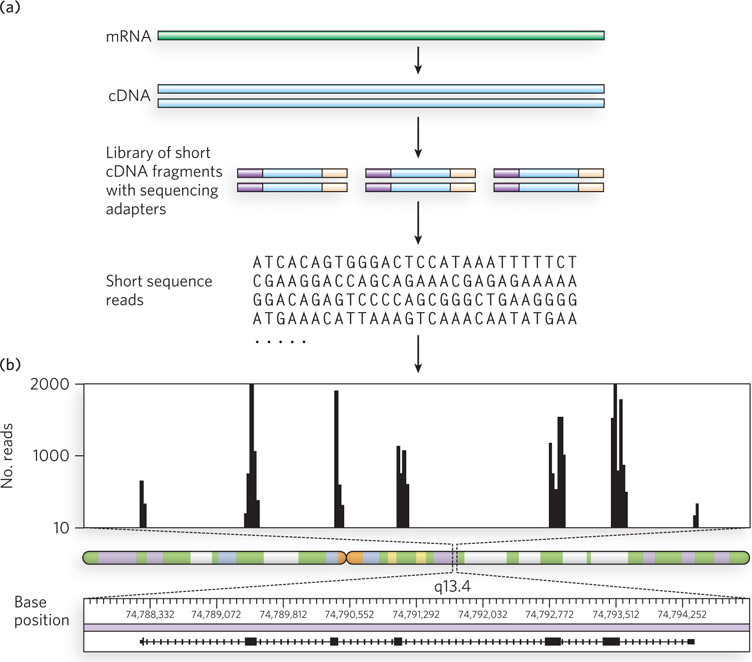
Figure 8-12: Use of RNA-Seq to examine transcriptomes (a) An mRNA is isolated, transcribed to cDNA, fragmented into smaller pieces, and ligated to adapter oligonucleotides that provide targets for sequencing primers. Sequencing then follows, using one of the methods described in Section 7.2. (b) The number of times a sequence from a given gene or segment of a gene appears in a sequencing read (i.e., the number of reads containing all or part of that sequence) is plotted. The number of reads from a given genomic region reflects the relative level of mRNA produced from that region. Shown here are data for a small portion of human chromosome 11, segment q13.4.
RNA-Seq provides information on gene expression levels with a much greater dynamic range and has proved highly accurate when compared with more laborious methods. The direct sequencing also provides additional information, showing the exact transcriptional boundaries of genes and revealing how exons are linked together in transcripts. In genes that have alternative splicing patterns (see Figure 8-5), the method can also reveal which exons within a single gene are being expressed at higher levels in a particular tissue. In some organisms, RNA transcripts are edited, producing new sequences not present in the DNA genes (a process described in Chapter 16). These sequence changes are directly revealed in RNA-Seq. As the costs of high-throughput DNA sequencing continue to decrease, RNA-Seq is replacing microarrays as the method of choice for transcriptome analysis.
The Proteins Generated by a Cell Constitute Its Proteome
In any effort to understand the metabolic status of a cell, the researcher must eventually look at the proteins. The complement of proteins present in that cell under a given set of conditions is called the cell’s proteome. The word “proteome” first appeared in the research literature in 1995. The subdiscipline of proteomics includes efforts to define the proteome. More broadly, any effort to analyze a complex mixture of proteins, whether or not it applies to all the proteins in a cell, falls under the proteomics umbrella. For example, some studies are directed at the proteins in a specific organelle or the proteins embedded in the cytoplasmic membrane.
The problems that proteomics researchers explore can be straightforward to describe, but the solutions often are not. Each genome presents us with thousands of protein-coding genes. We wish to know which proteins are present and contributing to cellular metabolism under every possible set of circumstances. Analysis includes the structure, posttranslational modifications, cellular localization, and detailed functions of all those proteins, as well as how the various proteins interact. Many research problems focus on particular cellular systems, encompassing a subset of proteins present at a certain time. Given that many proteins can still reveal surprises even after years of study, the investigation of an entire proteome or any complex protein mixture is daunting. Biochemists can now apply shortcuts in the form of new and updated technologies and databases that address protein function on a cellular level.
Transcriptome information tells us about RNA levels in a cell, but this does not necessarily inform us about protein levels. The expression of many genes, particularly in eukaryotes, is regulated at the level of translation. Messenger RNAs for particular genes are often stored in the cell in an inactive state until the protein product of that gene is needed. In addition, many proteins are initially synthesized in an inactive state, their function dependent on posttranslational modifications. A complete understanding of a proteome requires information about all modified states of a protein and how those states affect function.
Electrophoresis and Mass Spectrometry Support Proteomics Research
There are two principal ways to detect and identify proteins: polyacrylamide gel electrophoresis (see Highlight 4-1) and mass spectrometry. The resolving power of polyacrylamide gel electrophoresis can be amplified by carrying out two electrophoretic steps in succession, separating proteins on the basis of different properties; the technique is known as two-dimensional gel electrophoresis (Figure 8-13). The first step (or dimension) uses isoelectric focusing, a method that separates proteins on the basis of their isoelectric point, or pI (the pH at which the net charge of a protein is zero). Polyacrylamide gels containing an immobilized pH gradient are commercially available. Voltage is applied across the gel. Proteins migrate through the gel, halting where the pH of the strip equals the pI of the protein. In the second step, the gel strip is laid on top of another gel, and electrophoresis is carried out at 90° to the first step (i.e., in the second dimension), this time using an SDS-polyacrylamide protocol to separate proteins according to size.
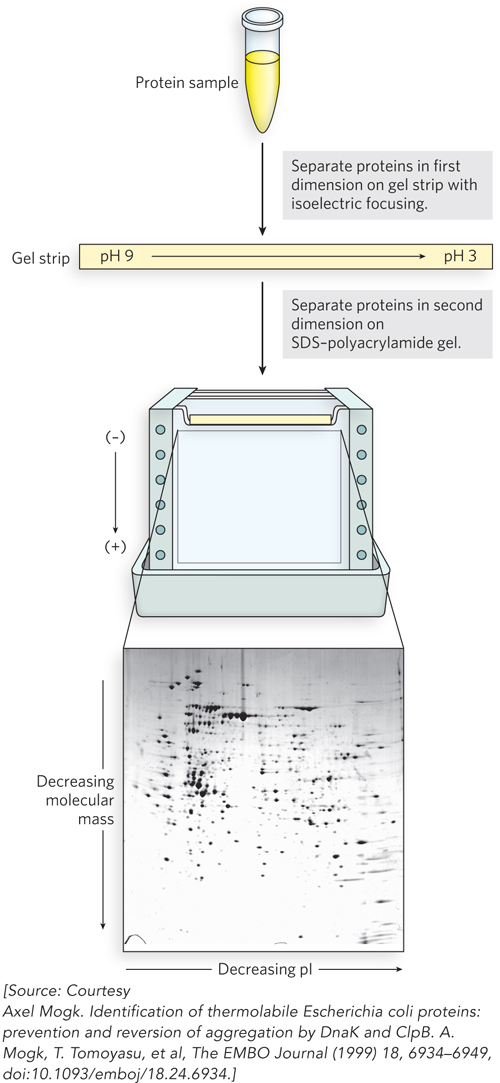
Figure 8-13: Two-dimensional gel electrophoresis of a complex mixture of proteins. In the first dimension, proteins are separated on a gel strip according to charge (i.e., pI) by isoelectric focusing. The strip is then laid on top of an SDS-polyacrylamide gel, and the proteins are separated according to size (i.e., molecular mass) by electrophoresis. The original protein complement is thus spread in two dimensions, aiding the separation of similar proteins into individual spots. The spots can be cut out of the gel and the proteins identified by mass spectrometry.
This technique allows the separation and display of up to 1,000 different proteins on a single gel. After staining to visualize the proteins, the gel can be compared with similar gels displaying the proteins in extracts from the same types of cells but under different conditions. The appearance (or disappearance) of particular protein spots in different samples can help define the cellular function of these proteins. Individual spots on the gel can be cut out and identified, typically with the aid of mass spectrometry. Two-dimensional gel electrophoresis is a robust procedure, and modern protocols are highly reproducible. Importantly, the method resolves complete proteins. Antibodies can be used to detect multiple modified variants of a protein and determine their relative abundance. However, the proteomes of cells more complex than bacteria or single-celled eukaryotes (e.g., yeast) are often too complex for adequate resolution using this method. Proteomic analyses are thus increasingly reliant on mass spectrometry.
The mass spectrometer has long been an indispensable tool in chemistry. Molecules to be analyzed, referred to as analytes, are first ionized in a vacuum. When the newly charged molecules are introduced into an electric and/or magnetic field, their paths through the field are a function of their mass-to-charge ratio, m/z. This measured property of the ionized species can be used to deduce the mass (M) of the analyte with very high precision.
Mass spectrometry (MS) provides a wealth of information for proteomics research, enzymology, and protein chemistry in general. Because the techniques require only miniscule amounts of a sample, they are readily applied to the small amounts of protein that can be extracted from a two-dimensional electrophoretic gel. The accurately measured molecular mass of a protein is one of the critical parameters in its identification. Once a protein’s mass is accurately known, mass spectrometry is also a convenient and accurate method for detecting changes in mass due to bound cofactors, bound metal ions, covalent modifications, and so on.
Modern mass spectrometry is by no means limited to characterizing the mass of pure proteins or identifying proteins cut out of polyacrylamide gels. Rapid evolution of this technology now allows the analysis of highly complex mixtures of proteins. The most common approach involves a refinement of mass spectrometry called tandem mass spectrometry, or tandem MS—effectively, two mass spectrometry procedures in succession. Typically, a protein mixture is extracted from cells or tissue and digested into peptides with a protease, and the peptides are fractionated (separated by liquid chromatography). As the peptides appear at the end of the fractionation, they are ionized and fed directly into the tandem mass spectrometer. The first of the two mass spectrometers sorts the peptides, which are then fed one at a time into a connecting chamber where each one is reduced—by collisions with helium or argon fed into the chamber—to a series of fragments, generally by breakage at peptide bonds. The fragments are next fed into the second mass spectrometer, where the m/z ratio of each is measured and its mass deduced. The collection includes a set of fragments that are related by the precise loss of mass corresponding to one, two, three, or more contiguous amino acid residues in the peptide. As the mass of each amino acid is distinctive, this allows the sequence of each peptide to be deduced. The final product is a long list of peptides, each of which has a known sequence and mass. The entire process is automated, and many thousands of peptides in a sample can be analyzed and recorded. With the wealth of genomic information available in the databases, each peptide is readily assigned to an individual protein. The relative abundance of a protein in a sample is generally proportional to the abundance of peptides derived from it in a sample. Numerous variants of the procedure have been developed that allow researchers to narrow the analysis. For example, it is possible to look only at phosphorylated peptides in a cellular protein mixture.
For the investigation of cellular systems, mass spectrometry is often paired with other techniques. For example, if a protein of interest is tagged (with a TAP tag; see Figure 7-27) and precipitated, the proteins it is associated with can be identified by mass spectrometry. A variety of methods can be used to increase or decrease the amount of a given protein in a cell, or eliminate it altogether (see Chapter 7). The researcher can then use tandem MS on the cellular proteome to determine how that protein’s absence (or increased abundance) affects other proteins in the cellular proteome. The possible variations in experimental design are limitless.
Computational Approaches Help Elucidate Protein Function
With the number and size of databases increasing rapidly, the information required to answer a biological question may be right at one’s fingertips. Increasingly, data-mining is complementing experimentation as a highly productive path to mechanistic and functional insights about genes, RNAs, and proteins.
Sequence Relationships A wide range of conserved amino acid sequences, many of them relatively short, have been reliably associated with particular protein functions. These sequence motifs, or structural motifs, are readily identified in sequence databases. When such a motif is found in a protein or group of proteins, an associated function is inferred and likely to be present (see Chapter 4). The motifs often correspond to binding activities (e.g., ATP, nucleic acids, NAD+, metals) or catalytic activities (e.g., helicase, polymerase, ATPase). The presence of a structural motif may suggest, for example, that the protein catalyzes ATP hydrolysis, binds DNA, or forms a complex with zinc ions, thus helping define molecular function. Resources for conducting searches for such motifs are available on the NCBI and Ensembl websites.
Structural Relationships Accurate determination of the three-dimensional structure of a protein is not always successful, but efforts are so common that structural databases are replete with protein structures of all types. Determination of the structure of a newly discovered protein can help define its function, as structural relationships often remain long after clear sequence homologies have been erased by evolutionary time. When a new protein is found to have structural folds that are clearly related to motifs with known functions in the structural databases (see Highlight 4-2), this information can suggest a molecular function for the protein.
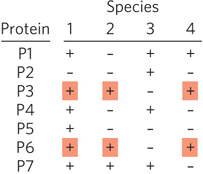
Figure 8-14: Use of comparative genomics to identify functionally related genes. This example of phylogenetic profiling shows gene comparisons for four organisms. P1 through P7 indicate proteins encoded by each species. The + or − indicates presence or absence of the protein. The technique does not require homologous proteins. Because proteins P3 and P6 always appear together in a genome (red shading), they may be functionally related. In particular, they may have a function that is found in species 1, 2, and 4, but not in species 3. Further testing would be needed to confirm this inference.
Comparisons of Genome Composition Although not evidence of direct association, the mere presence of combinations of genes in certain genomes can hint at protein function. One can simply search the genome databases for specific genes, then determine which other genes are present in the same genomes—a process known as phylogenetic profiling (Figure 8-14). (Phylogenetics is explained in more detail in Section 8.3.) The consistent appearance of two genes together in a genome suggests that the proteins they encode may be functionally related. Such correlations are most useful if the function of at least one of the proteins is known.
Phylogenetic profiling is often carried out on hundreds or thousands of genes at once, in broad studies that complement approaches such as linkage analysis. The search for a gene called BBS5, involved in Bardet-Biedl syndrome (BBS), provides an example. Bardet-Biedl syndrome is a serious genetic condition characterized by retinal degeneration, obesity, a variety of physical deformities, and learning disabilities. Six BBS genes discovered before BBS5 were found to be involved in the function of a cellular structure called a flagellar and basal body. BBS5 had been localized to a region in chromosome 2. To facilitate identification of the gene in this region, the researchers did a phylogenetic profile, comparing human genes and genes of the green alga Chlamydomonas—species that possess flagellar and basal bodies—with genes of the plant Arabidopsis, which lacks this cellular structure. They generated a list of 688 genes present in humans and Chlamydomonas but absent in Arabidopsis. The region of chromosome 2 that interested the researchers had a total of 230 genes, but only 2 of them were on the list of 688 generated by the phylogenetic profile. One of these turned out to be BBS5.
Experimental Approaches Reveal Protein Interaction Networks
Every protein functions by interacting with other molecules, from small metabolites to nucleic acids and other proteins. One of the strongest clues to protein function is knowing which other proteins that protein interacts with. For example, if a protein of unknown function interacts with an RNA polymerase, there is a good chance that the protein is also involved in transcription. Powerful new technologies are providing information on protein interaction networks in cells.
Protein Chips For large-scale studies, proteins, like nucleic acids, can be immobilized on a solid surface, forming protein chips—a kind of protein microarray. These can be used to detect the presence or absence of other proteins in a sample. For example, an array of antibodies to a particular set of proteins is immobilized as individual spots on a solid surface. A sample of proteins is added, and any proteins that bind an antibody on the chip can be detected by a variety of methods. However, whereas DNA is consistent in its physicochemical properties and is readily immobilized on silicon chips, proteins vary a great deal in their properties, and the construction of protein chips can be challenging. The conformation of many proteins depends on solution conditions, and immobilization on a silicon chip may inactivate some proteins in a manner that is not always predictable. Nevertheless, many successful efforts have been reported.
Probing Macromolecular Interactions In Vivo The study of protein-protein interactions by the two-hybrid method (see Figure 7-28) and the study of protein-RNA interactions by the three-hybrid method (see Figure 7-29) rely on macromolecular interactions that occur in vivo. Both are important avenues for examining protein interaction networks in proteomics research. A somewhat different approach to detecting protein interactions in vivo involves immunoprecipitation of proteins from cell extracts. Antibodies are used to precipitate a given protein, and the precipitate is examined to identify (by mass spectrometry) any other proteins that were associated with the target protein in the cell and thus precipitated with it. This is a variation on the use of a TAP tag (see Figure 7-27).
Miscellaneous Approaches The proteomics literature is replete with examples of creative approaches to dissecting protein interaction networks. One approach is the search for “Rosetta stone” fusions. Sometimes, two proteins that exist as separate entities in species 1 may have orthologs in species 2 that are the product of two fused genes. This fusion in species 2 makes it highly likely that the two proteins in species 1 interact. Another approach simply mines the biochemical literature, focusing on proteins that are mentioned together in the same article. If two proteins are mentioned together in a large number of publications, the assumption is made that the two may interact.
SECTION 8.2 SUMMARY
A transcriptome is a listing of the genes that are expressed in a given cell under a defined set of conditions. The transcriptome may change in response to environmental changes or cellular signals.
Microarrays provide one picture of cellular transcriptomes. The RNA-Seq approach is even more effective in generating a detailed transcriptome.
A proteome is a compilation of all the proteins present in a given cell under a defined set of conditions. Computational and experimental techniques explore the proteome, as well as the functions of the proteins it encompasses, on a cellular scale.
The most common approaches to examining a cellular proteome under a defined set of conditions are two-dimensional gel electrophoresis and mass spectrometry.
The generation of protein interaction networks is one of the goals of proteomics research. Techniques include protein chips, two-hybrid and three-hybrid methods, immunoprecipitation, and protein fusions.