DATA ANALYSIS PROBLEM
Oxender, D.L., G. Zurawski, and C. Yanofsky. 1979. Attenuation in the Escherichia coli tryptophan operon: Role of RNA secondary structure involving the tryptophan codon region. Proc. Natl. Acad. Sci USA 76:5524–
Question 20.20
Unraveling of the complicated regulatory mechanism of the trp operon proceeded in stages over more than a decade. The work was carried out mainly in the lab of Charles Yanofsky at Stanford University. Beginning with a study of tryptophan synthase in the early 1970s, Yanofsky’s group gradually focused on regulation of the trp operon. They initially thought that regulation could be explained in terms of a lac operon–
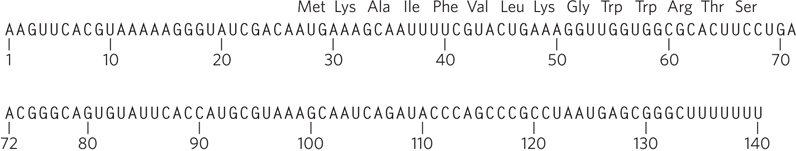
In the study published in 1979, Yanofsky and his colleagues explored the secondary structure in the leader region of the trp mRNA, in work that defined the outlines of the overall regulatory system. They used the enzyme RNase T1, a ribonuclease that cuts single-
The band A RNA (Figure 2) is approximately 140 nucleotides long. What species is this, and what can be said about the three bands that appear when it is separated on the denaturing gel (Figure 3)?
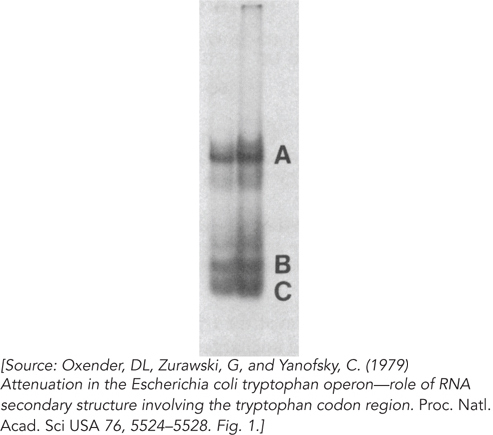 FIGURE 2
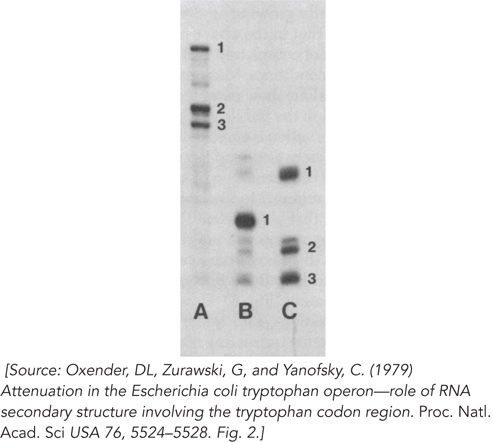 FIGURE 3
Bands B and C are smaller than band A. What does this tell you?
The band C RNA also separates into three species on the denaturing gel, but the band B RNA does not. What can you conclude from this?
The authors went on to identify the RNA species on the gels. Band B consisted of sequences from approximately position 108 to the 3′ end of the RNA. Band C1 was the segment from approximately position 51 to position 95, with C2 and C3 arising from an additional cleavage at around position 70.
726
From what you know about the attenuation mechanism, which regions of the RNA are present in band B?
Which regions are present in band C?
Are there any missing elements of secondary structure that are important to the regulatory mechanism? If so, what are they, and why might they be missing from the isolated RNA?