7 Bell-shaped Curves
What exactly do we mean by “bell-shaped”? The distribution should be roughly symmetric, with its peak near the center of its range, and the heights of the boxes decreasing as you move to left and to the right of the peak. To see this more clearly, consider the histogram in Figure 3.2. Although it is clearly not a perfect fit, the curve approximates the overall pattern of the distribution and resembles a bell, with its base sitting on the horizontal axis.
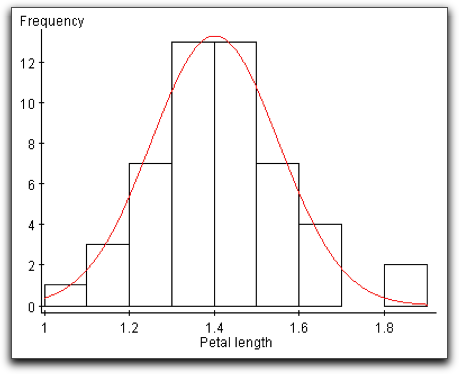
The graph at right is a histogram that we saw earlier in the chapter, displaying the distribution of petal lengths in centimeters for a sample of Setosa iris. We can see from the overlaid curve that this distribution is also bell-shaped.
The petal lengths graphed in this histogram are given in the following table:
Setosa Iris Sample Petal Lengths
Answer the following questions about this sample of data to make sure you've grasped all the concepts presented so far in this section.
Analyzing petal lengths
Question
3.7 Analyzing petal lengths: using the empirical rule
Use the Empirical Rule to determine the intervals in which 68%, 95%, and 99.7% of measurements should lie (round all calculations to four decimal places):
_max_tries:3
_feedback_correct: That's right.
_feedback_incorrect_first: That's not right. Here's a hint: 68% of lengths should lie between 1 standard deviation below and above the mean. Since the mean is 1.462 and the standard deviation is 0.1737, the upper bound for the 68% interval is 1.462 + 0.1737 = 1.6357.
_feedback_incorrect: See the correct answers above.
Question
3.8 Analyzing petal lengths: checking the empirical rule
Finally, use the petal length data to determine percentages actually lying in these intervals:
_max_tries:3
_feedback_correct: That's right.
_feedback_incorrect_first: No. To answer these questions you'll just have to count values in the table.
_feedback_incorrect: See the correct answers above.
Question
3.9 Analyzing petal lengths: how well did the empirical rule work?
Is the Empirical Rule a reasonable estimate of the actual percentages?
_feedback: The Empirical Rule underestimates the percentage of measurements within one standard deviation of the mean, but provides reasonable estimates of percentages within two and three standard deviations of the mean.