Chapter 2. Data Collection and Design of Experiements
Introduction
Many of the questions that people investigate require data in order to draw valid conclusions. Researchers—whether professional or amateur—obtain data from existing sources, from observational studies, or from experiments. In this chapter we examine the methods for obtaining data from observational studies and experiments, focusing on study design, randomization and sample selection, and drawing conclusions.
2.1 Conducting an Observational Study
Observational studies are widely used to investigate conditions and characteristics of populations, to estimate values of parameters of individual groups, to compare changes in parameters over time, or to compare parameters of two or more groups.
2.1.1 The Role of Randomization
Oceana is a charitable organization dedicated to improving earth’s oceans. Among the organization’s campaigns is one to stop seafood contamination. Of particular concern to Oceana is the level of mercury in fish. Mercury is a toxin that is particularly dangerous to children; a woman’s exposure to mercury during pregnancy can affect her unborn child. The FDA warns women of child-bearing age and children against consuming fish with high-mercury levels, and recommends limiting the amount of lower-level mercury fish eaten as well.
As part of their campaign, Oceana conducted a mercury sampling project in which volunteers purchased fish samples from grocery stores and sushi restaurants in 26 American cities; the mercury content in each one was analyzed. In addition, the volunteers questioned grocery store workers about government advice on mercury in seafood for women thinking about having children.
This study is clearly an observational one. The intent is to report on the mercury level in purchased fish, and to determine whether grocery store clerks know the FDA advisory. No treatment was applied to either the fish or the clerks; information from each group was recorded, summarized and reported.
Let’s take a closer look at the design of this study. Volunteers collected fish samples between October 25 and November 13, 2007, from grocery stores and sushi restaurants in 26 American cities. They were asked to purchase swordfish and tuna steaks from the grocery stores; if either fish was unavailable, tilapia was substituted. At the sushi restaurants, volunteers were to purchase samples containing tuna and mackerel.
To assess seafood counter clerks’ knowledge of FDA recommendations, volunteers asked “What is the government advice on mercury in seafood for women who are thinking about having kids?” in 40 stores in 38 cities.
In this instance, there are really 3 samples: the fish purchased from grocery stores, the fish purchased from sushi restaurants, and the fish purchased from the grocery store clerks. For this (or any other) study, we are interested in two questions. How random were these samples, and do they accurately reflect the populations of interest? These questions are difficult to answer in this case. There is no discussion in the report of how the cities were chosen or the grocery stores selected, and the restaurants were chosen by the volunteers, not by a random process.
Randomization is an important feature of statistical design. Randomization is the use of impersonal chance either to select individuals to study or to assign individuals to treatment groups. Statisticians use randomization to avoid bias in study results. Bias is the predisposition of a study toward certain results; it caused by problems in the study design or sample selection. (For example, asking bicyclists whether road improvement funds should be used to create dedicated bike lanes is likely to produce a higher rate of affirmative answers than asking the same question of the general public.)
Whenever a study depends on volunteers (and they frequently do), it is important to remember that their responses (or choices, in this case) may introduce some amount of bias into the results. Here there may be nothing wrong—the samples of fish selected may be every bit as “good” as ones selected randomly. And that is really the point of the second question—do they accurately reflect the situation across the country? What we are asking is not whether the sample is random (it isn’t), but rather whether it is representative of what the average consumer would purchase in his or her favorite grocery store or sushi restaurant.
Again, we just don’t know. Randomization gives us the best chance of getting a sample that represents the population, so when a study design does not include randomization, we wonder about the results. Some people would say the samples in the Oceana report are fine, and the results can be trusted. Others would want to know more about the selection method. Statistics is about making decisions at all stages of the process. As a consumer of statistics, you get to decide; our goal is to help you make informed decisions.
2.1.2 Bias in Opinion Polls and Surveys
You can view the video Snapshots: Sampling to see how polling organizations take great care in designing surveys of public opinion.
When an observational study is a poll or survey in which human beings answer questions, study design becomes even more complicated. Professional polling and market research organizations design surveys to minimize any factors which might introduce bias in the results, and use randomization to produce samples that are representative of the population of interest.
A major concern in all survey design is response bias, any aspect of the design that influences the participants’ responses. Response bias comes from a number of sources: the topics covered in the survey, the kind of questions asked, how they are worded, the behavior of the interviewers (if there are any), and the behavior of the respondents.
If the survey covers sensitive topics, such as behavior considered immoral or illegal, respondents are inclined to answer questions as they believe they should, whether those answers are entirely truthful or not. People also tend to overestimate behavior perceived as good. Questions such as “Did you vote in the last election?” typically produce a higher percentage of “voters” than actual returns show. How the respondent perceives an interviewer, or how the respondent believes the interviewer perceives him or her, can also affect answers.
In designing a survey, researchers must decide whether to use open or closed questions. An open question is one that allows the respondent to answer as he or she chooses. A closed question is one in which the respondent must choose an answer from a set supplied by the interviewer. Closed questions limit the participants’ choices, and may thereby overestimate certain opinions.
The particular wording of a question can change the results as well. The Pew Research Center for the People and the Press frequently creates two versions of a survey, with the respondents randomly assigned to one of the two forms. Since randomization creates two groups of individuals that are essentially the same, any difference in response can be attributed to the difference in wording.
To illustrate this, the Pew Center’s website describes a survey taken in January 2003. On Form 1, they asked the question, "Would you favor or oppose taking military action in Iraq to end Saddam Hussein's rule?" On Form 2, they asked the question "Would you favor or oppose taking military action in Iraq to end Saddam Hussein's rule even if it meant that U.S. forces might suffer thousands of casualties?" As you might expect, more people who answered the Form 1 question favored military action (68%) than those who answered the Form 2 question (43%).

The NPR story Death-Penalty Opinion Varies With the Question discusses the effect of question wording on survey results.

Click here to discuss Death-Penalty Opinion story.
2.1.3 Difficulties in Sampling
Selecting a representative sample begins with identifying the sampling frame, a list of the individuals that make up the population. In some cases this can be an actual list (all 2011 graduates of your college), but frequently it is a more theoretical one (all adult Americans). For many decades, in order to survey adult Americans, polling organizations used households with landline telephones as the sampling frame. The sample households actually contacted were then selected using various forms of random digit dialing.
The scholarly article Why the 1936 Literary Digest Poll Failed discusses problems with the Literary Digest poll. Similarly, US Election 1948: The First Great Controversy about Polls, Media, and Social Science points out how errors in the 1948 polls lead to improvements in the polling process.
In selecting the sample, researchers must address the issues of undercoverage and nonresponse. Undercoverageis underrepresentation in the sample of a group or groups of individuals in the population. A sampling frame which uses households with landline telephones to select a sample omits households without a landline telephone. Historically, these households were less affluent, because not having a landline meant not having a telephone at all.
A Literary Digest poll in 1936 used the opinions of over 2.3 million individuals, chosen primarily from phone directories and car registries, to predict that Alf Landon would defeat Franklin Roosevelt in that year’s presidential election. In depression-era America, having a phone or a car were characteristic of wealthier households, with individuals more likely to vote for the Republican candidate Landon. Many statisticians believe that this undercoverage of less wealthy Americans is responsible, at least in part, for the incorrect prediction.
In recent years, however, households without landlines include those which use only cell phones. The persons in cell-phone-only households are different in several important characteristics from those in landline households; age is certainly one of those characteristics, as cell-phone-only households tend to be younger.
Studies have been done to compare the results of surveys that include cell-phone-only individuals with those that do not, and to correct for undercoverage when cell-phone-only users are not part of the sampling frame. In 2007 an entire special issue of Public Opinion Quarterly was devoted to cell phone numbers and telephone surveys. Pollsters have more recently tested surveys that include a combination of landline, cell phone, text messaging and Internet answers to avoid undercoverage.
The NPR story Capturing Cell Phone-Only Users in Political Polls discusses the characteristics of cell phone-only users and their effects on political polls.
Click here to discuss Cell Phone-Only Users in Political Polls story.
Another factor that contributed to the prediction error in the 1936 Literary Digest poll was nonresponse, the failure of individuals selected for the sample to actually participate in the study. More than 10 million “straw ballots” were mailed out, but less than 3 million were returned. It is believed that those who failed to respond favored Roosevelt more than Landon.
Today researchers use statistical methods to decide about appropriate sample sizes, and they make multiple attempts to contact each individual in order to minimize nonresponse. And, back to the cell-phone issue, pollsters have found that they need to call more people when surveying cell-phone-only users because there is a higher refusal rate with this group. This may be due to the fact that people are potentially busier when contacted on their cell phone rather than a house landline; for instance they may be driving, in class, working, or socializing when the call comes in.
Why all this fuss about choosing the sample? Wouldn’t it be easier to just put your survey on the internet, and let whoever feels like it reply? Easier, yes; more useful, no. Statisticians are particularly wary of voluntary response samples, in which individuals choose to respond to a particular question. Without randomization, there is no way to judge how closely the respondents match the desired population in important characteristics, or to measure the error in any predictions based on the results. Voluntary response surveys can be fun—the popularity of American Idol attests to that, but if you want to rely on the numbers you get, you should start with a properly chosen random sample.
2.1.4 Examining an Opinion Poll
In November, 2007 Pew Research Center reported on its findings from a telephone poll on racial attitudes taken from September 3 to October 6 of the same year. Their results showed that many African Americans believed that the gap between the values of middle class and poor blacks was widening. One-fifth of blacks said that things were better for blacks than 5 years earlier; whites were nearly twice as likely as blacks to see black gains in the past five years.
The Pew Research Center is a well-respected social research organization, whose reports are widely quoted in the media. Let’s take a look at the methods used in this poll to minimize bias and produce reliable results.
Survey Design: The survey consisted of 42 questions, some with follow-up questions. Most of the questions were closed; a typical question was “Do you think white students and black students should go to the same schools or to separate schools?”
Because the order in which choices are presented may influence respondents’ answers, for some questions, order choice was rotated. For example, in a question asking about the seriousness of various local problems, the choices crime, high school students dropping out, the number of children born to unmarried mothers, the lack of good paying jobs, the quality of the public schools, and illegal immigration were given in different orders to different individuals.
Questions about racial attitudes are often sensitive; people may hesitate to answer honestly, particularly if they perceive that the interviewer is a person of a different race. In this survey, care was taken to have African-American interviewers question African-American respondents; 82% of African-Americans were interviewed by black interviewers. Similarly, 76% of white respondents were interviewed by non-black interviewers.
Sample Selection: The sampling frame here consisted of adult Americans (African-American, Hispanic and white). The survey interviewed 3,086 adults living in telephone households in the continental United States. Interviews were conducted in English or in Spanish. Two separate samples were used. One sample of 2,522 households was selected by a random digit dialing method in which more numbers were chosen from areas with higher concentrations of African-American and Hispanic households. A second sample of 564 households were those screened for (but not used for) a previous survey; each of these households contained an adult African-American.
Telephone numbers were called up to ten times, and at different times of day, in an attempt to reach all numbers. In each contacted household, interviewers asked to speak with the youngest male adult currently at home. If no male was available, the interviewers asked to speak with the youngest adult female at home. This methodology produces samples that are more representative of the population in terms of age and sex, as compared to interviewing whatever adult answers the phone.
Data Reporting and Analysis: The statisticians who analyze data for professional polling organizations employ methods much more complicated than those we will study. In this particular survey, researchers used a technique that adjusts for effects of study design and implementation that might introduce bias.
But some basic principles that will be important to us apply here. Because such a study yields sample statistics that are used to estimate population parameters, researchers typically report not only summarized data, but also approximate margins of error attached to these estimates. A margin of error is a number that estimates how far the desired parameter might be from the reported statistic. It establishes a range of values higher and lower than the statistic within which the parameter is likely to fall.
For this study, researchers reported margins of error as indicated in the table below.
| Sample Size | Margin of Error (percentage points) | |
|---|---|---|
| Entire Sample | 3,086 | 2.5 |
| Non-Hispanic Whites | 1,536 | 3.5 |
| Non-Hispanic African-Americans | 1,007 | 4 |
| Hispanics | 388 | 7 |
The survey found that 15% of the entire sample believed that illegal immigration was a very big problem in their local communities; the margin of error for the entire sample was 2.5%. This means that the true percentage of all Americans who held this belief was likely to be between 12.5% and 17.5%.
It is easy to see that the larger sample sizes had smaller margins of error. In fact, researchers often select a sample of a certain size in order to have a desired margin of error.
There is always a margin of error in sample surveys. The sample does not contain all members of the population, and so is unlikely to match its characteristics exactly. Also, the samples themselves vary; if the Pew researchers selected another sample of 3,086 people, even of the same racial composition, the percentages reporting particular answers would seldom be exactly the same.
In addition to reporting summary statistics, sample sizes and margins of error, researchers often indicate the response rate for the survey. The response rate for this Pew Research Center Survey was 24%. This represents the percentage of the households initially selected who actually completed an interview. Interestingly, this is approximately the same response rate as the Literary Digest poll, a response rate cited as a possible cause of the incorrect prediction.
Why is the Pew Research Center willing to publish a poll with such a low response rate? As polls have become more numerous, Americans busier, and caller ID more common, response rates for national polls have declined. The Pew Research Center itself conducted experiments which compared usual polling techniques with more rigorous ones designed to obtain a higher response rate. These and other studies indicate that carefully designed polls do obtain representative samples and accurate results. The article Gauging the Impact of Growing Nonresponse on Estimates from a National RDD Telephone Survey in the journal Public Opinion Quarterly reports on such an experiment.
Question 2.1
In early 2008 there were a number of incidences of public officials involved in sex scandals. The Gallup Poll conducted a survey in March of that year to determine opinions concerning unfaithful spouses. Read the Gallup Poll report and answer the following questions.
PBi3ud7UJuoj8DIj2l1WjHO5lxWkMlfoqQ1Ov2K8OORScnavAZLOl6XxzO3D7zcR23Z4RNcHBuNzawnnnn/ot80iYRsoUCeMLk2e8Ji5OzTbgWyLSaqiYELtUX3VFH++p6q12pwiR3l+Od13anpLKOEJSvEbhK1ZHH8FZ6m+YZy8AxShm1p3Kq8JXb4sWnqsdJ3INMgJSwdMXlj975MJIJCEqgeFQew3rkmPwSBx8mcAm9GIaVQcipuR5dmMRFDnRvJd2nCBLelTwUFBVI5ALLifS6iAY0gRQ0XeIpdcnKRGCz80dwsD/CC+7slV2NlrWgaxYwzFLX0LOebVDM4WJ1Q5qbzoL19bF30msgKZqaoKguR/dvF+qNa3ynpa3miK(2) 1025
(3) ±3%
(4) The questions given in the report were closed.
(5) Yes, the choices for questions 30 and 31, given in the report, were rotated.
(6) The response rate for the survey was not given.
2.1.5 Drawing Conclusions from an Observational Study
When the Supreme Court struck down Washington, DC’s ban on handguns in June, 2008, it served to re-ignite the debate over the effect of such legislation. A 1991 study by University of Maryland researchers investigated the effects of restricting access to handguns on gun-related homicides and suicides. The study investigated homicides and suicides committed from 1968 through 1987, classifying them by location (DC or adjacent metropolitan area without the ban), cause (homicide or suicide), method (firearm or other), and time of occurrence (before or after the ban).
Average monthly totals for before the ban and after the ban were calculated. The study found that in Washington, D.C., after the ban, the numbers of both homicides and suicides by firearms were reduced by more than 20% (by 3.3 per month for homicides and 0.6 for suicides). In adjacent areas without the ban, no such decreases were found.
Here we have two variables that seem to be related. The number of homicides and suicides by firearms is the outcome that we are studying; we wonder if the number of firearm deaths “responded” to the presence of the ban. For this reason, we call the number of such deaths the response variable. The response variable in a study is the outcome that we are investigating. Another way of phrasing our research question is “Does the presence of the handgun ban ‘explain’ the number of deaths?” Thus, we refer to the presence of the ban as the explanatory variable. The explanatory variable in a study is the variable that explains or predicts the values of the response variable.
Do these results show that handguns cause homicides and suicides? Or that the ban stops them? Unfortunately, it’s not that simple. What the results show is that after the ban, firearm deaths declined in Washington, D.C. Just because the decrease followed the ban, it was not necessarily caused by it. Perhaps factors that were not studied (such as changes in gang activity or employment rates) contributed to the decrease. We refer to these other factors as lurking variables. A lurking variable is a characteristic of the sample that is not investigated as part of the study, but which may influence the results. The inability to distinguish between the effects of explanatory and lurking variables on the response variable is called confounding.
In order to establish a cause-and-effect relationship, an experiment must be performed. But in many cases, such as this one, an experiment is not possible. Controversies arise when different observational studies point to different conclusions; in fact, this has been the case with gun control studies. In the case of the link between smoking and lung cancer, many, many observational studies were conducted over many, many years before scientists were willing to state definitively that smoking is a cause of lung cancer.
Question 2.2
Former and current drug users are at increased risk for contracting the Hepatitis C virus (HCV) because the virus can be transmitted through shared needles. In a California study, seventy-one recovering drug users on methadone maintenance who had HCV were treated with interferon plus ribavirin for 24 or 48 weeks. About a third of the subjects used marijuana while being treated; according to the researchers, marijuana use was neither endorsed nor prohibited. At the end of the treatment, the individuals’ HCV viral load was measured. Sixty-four percent of marijuana users had undetectable viral load, while 47% of non-users did.
SiPeSg5kdqGtGW688fbbQYp6nPibom29ngA/QNbITpm9DxsZnH5fkoK5kSsChxra58yV5CK978Ih8T9/wVb9y2DwIh9rm54Gz/RRYkMEY3KeheZuW5Motu1qIFgTDst+X9W8glOXmPmcuIQkWa02jzEue4j0aU6k8g/lQFLypvILi+8px/zE9crpss3E8dOkmLzXk5cruR6XSmr7r1FcaHRM3AF8xEtObNjLp+xdNPx5YcGEMvF9+L5F6y9l1rE7hBCGkS1D2qdYmrkStkx/YDsDiV+JlpWoE0VQLvuc+12ga+4trvSfpF4WRAmq+g/SbZQ/kz93AVkrv5n8fl80eyTehb2js6XkMXqZNY1Tm9Cx1aPRiBHDx9g527em69I/mYsM6sQp1SUwsguJgNa/P8O4lNPFVe6TLSPOmBnv6cuVR4hNyTSipkIisbnYZkOATk/vrZDqW0bmDsN2dYOPcS4Ax5Ue8Sa7c5ZCYdGc3X0=(2) HCV viral load
(3) Marijuana use
(4) The study was an observational one, not an experiment. Factors such as age, general health, or beginning viral load could be lurking variables that influence the outcome.
The video Snapshots: Types of Studies shows how an observational study led to an experiment concerning the cause of coral reef decline.
While observational studies, including polls and surveys, can be valuable tools in gathering information, they do require care in their design, implementation, and interpretation. We will continue to return to issues discussed here as we present additional concepts and procedures. In Section 2.2 we will look at experiments, and how they can be used to link cause and effect.
2.2 Designing an Experiment
We have previously discussed the importance of using experiments to establish cause and effect relationships between variables. That is the “why” of experiments. In this section, we investigate the “how” of experiments—designing and conducting experiments so that the results are meaningful.
2.2.1 What Is a Randomized, Comparative Experiment?
Researchers in Denmark conducted a study to investigate whether nicotine patches were safe and effective in quitting smoking. In the abstract for an article in the New England Journal of Medicine, they described their methods and results as follows:
“METHODS. We conducted a double-blind randomized study comparing the effects of a 16-hour nicotine patch (15 +/- 3.5 mg of nicotine in 16 hours) with those of a placebo patch. Of the 289 smokers (207 women and 82 men) enrolled in the study, 145 were treated with nicotine patches and 144 with placebo patches for 16 weeks.
“RESULTS. Rates of sustained abstinence were significantly better with active treatment than with placebo: 53, 41, 24, and 17 percent of those in the nicotine-patch group were abstinent after 6, 12, 26, and 52 weeks, respectively, as compared with 17, 10, 5, and 4 percent of those in the placebo-patch group (P less than 0.0001). Only two subjects with the nicotine patch and one with the placebo patch had to withdraw from the study because of side effects.”
The explanatory variable for this study was the type of patch received, and the response variable was whether the individual continued to abstain from smoking, as measured at four intervals up to one year.
This study was an experiment, because there were two treatments involved (the nicotine patch and the placebo patch), and comparative, because the results from the nicotine patch group were compared with those of the placebo group. A placebo is an inactive treatment that has no medical effect, but resembles the active treatment in all other aspects. Here the placebo served as the control treatment, a treatment used to establish the effect of not treating the individuals medically. A study that uses a placebo as a treatment is called placebo-controlled.
In this experiment, the placebo was used in order to determine whether the nicotine in the patch, rather than just having a patch, caused the increase in abstinence from smoking. In a phenomenon known as the “placebo effect,” some people improve just because they are part of a study or are receiving a treatment, regardless of whether the treatment is “real” or not.
The researchers described their study as double-blind. This means that all those directly involved with the experiment do not know which individuals are receiving the active treatment, and which are receiving the placebo. This includes not only the subjects of the experiment, but also those administering treatments or interpreting the results. It is difficult for those conducting the experiment, as well as the subjects themselves, to avoid influencing the outcome if they know who is getting what treatment. Double-blinding minimizes the chance of such bias. (An experiment is single-blind if either the subjects or the researchers, but not both, do not know who is receiving what treatment.)
The final characteristic of this study is that it is randomized. Recall that randomization was also an important aspect of sample surveys. For sample surveys, randomization involves using impersonal chance to select the sample from the sampling frame. For experiments, the randomization occurs not in sample selection, but rather in the assignment of individuals to treatment groups. This randomization is the best method for creating treatment groups that are, as much as possible, similar in all regards except for the treatment. This allows us to conclude that differences in outcome are due to differences in treatment.
In the results of the study, the researchers state, “Rates of sustained abstinence were significantly better with active treatment than with placebo.” What does “significantly” mean here? The researchers are stating that their results are statistically significant; that is, the differences between treatment groups are so large that they are unlikely to have occurred merely by chance. And if it wasn’t chance, then it was probably the difference in treatment—the nicotine in the patch—that caused the differences in the results.
When we looked at sample surveys in the previous section, we wanted to see the nonresponse rate. In the case of experiments, we have similar questions. How many of the individuals who began the study actually completed it? Why did individuals drop out? In this study, two subjects who received the nicotine patch and one who received the placebo dropped out because of side effects.
An easy way to “see” how an experiment is to proceed is to draw a picture of the design. The picture below shows the design of the nicotine patch experiment.
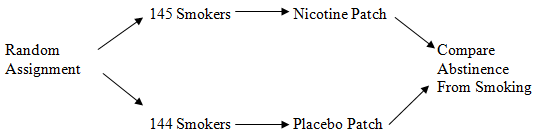
This study is an example of the simplest form of a randomized comparative experiment. The participants are divided into only two treatment groups; if there were three treatments, the random assignment would require dividing the subjects into three groups. The middle part of our picture would then have three lines rather than two, but the random assignment that begins the process, and the comparison of results that end it, would remain the same. In any well-designed experiment, we always begin with random assignment of individuals to treatment groups, and end by comparing the values of the response variable.
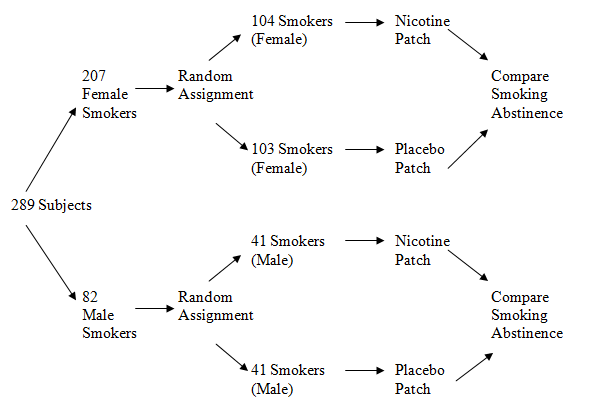
It has been shown that some medications work differently in men than in women, so the researchers in this study might have grouped all the women together and all the men together before dividing each gender into treatment groups. We say that such a study has a block design. A block is a group of individuals that share one or more characteristics. Using a block design helps to eliminate the variations caused by the differences between the blocks—in this case, the differences due to sex. The picture below shows a block design for the nicotine patch experiment.
Question 2.3
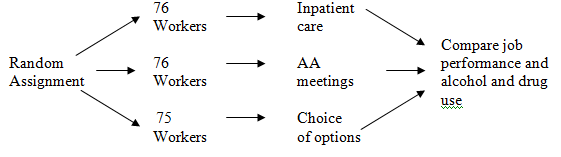
In a study conducted by the Harvard School of Public Health, 227 workers identified as abusing alcohol were randomly assigned to one of three rehabilitation programs sponsored by their employers: compulsory inpatient treatment, compulsory attendance at Alcoholics Anonymous meetings, or the participant’s choice from a set of options. Workers were then compared on job performance and subsequent alcohol and drug use.
73lXtfxvKpHBxIswul8fPTjwMzYr8ssHJV3jAq1NJQeOazm431GlokLk6A82PYT47GrlNahb2g0PRH85Y73Py5WJifkCBNyjbvncr3GcVbIC3GlmUqUtkRUPN7+1IwpPw0kNYlC5jO2lBXepLd5sVWEiX3S3mqAG7coCmr6lnnp1OMa08q4+UIZDkQmu+Uy6NItbAaI8kvzecQ7hRr3sCPMl8Q9GOdkW9DqOD+MTX6Q39tKt7Dlezg2uIsxMlG/n3BJKdppotO/R/EYoGizJB16nYx3PONs3MnA0E6rJtmbJbsV2OENgOCjDf8a4Wi2CW2VyTXvTeg1ZIaJ3p+cgypLlFsIfizgDbkxv+TSYsO91rexfPZKm3fsq0+jO4wpw1gAvhKsYOevnxaDluKmLAyMlltzBAw0DZV1NSw==(1) The explanatory variable was type of treatment.
(2) The response variables were job performance and subsequent alcohol and drug use.
(3) There were 227 workers involved in the study.
(4) There were three treatments: compulsory inpatient care, compulsory attendance at AA meetings, and the participant’s choice of options.
(5) The study was not placebo-controlled; all three treatments were active. In this case it would not be possible to administer an inactive treatment; the subjects would know they were not being treated.
(6)
The video Snapshots: Experimental Design explains how researchers designed an experiment to determine whether nutritional supplements improved knee pain in arthritis sufferers.
As seen in these examples, a well-designed experiment has three critical properties:
- Control of extraneous influences on the response variable by comparing two or more treatments;
- Randomization of individuals to treatment groups;
- Replication of treatment to a number of individuals.
Experiments that lack these properties have conclusions that are open to question.
2.2.2 Matched-Pair Experiments
In order to control for variables not studied, researchers, particularly in the social sciences and education, use matched-pair designs in their experiments. Two individuals, matched according to important characteristics, are “paired,” with one individual from each pair randomly assigned to the first treatment, and the other to the second treatment. Typically, one of the groups receives the control treatment (a placebo or no treatment), while the second receives the experimental treatment, although two experimental treatments may be administered in some circumstances.
A number of years ago, researchers investigated the question “Does Transcendental Meditation affect grades?” by using sex, college, year, grades, and first letter of last name to match 70 students who took Transcendental Meditation training with students who had not had the training. They compared GPAs one and two quarters after the training, and found no significant difference between those who had the training and those who did not. This is a classic example of a matched-pair design, although in this case the study is an observational one, not an experiment.
Perhaps no set of individuals is as appealing to researchers as subjects for an observational study or an experiment as identical twins. Identical twins, having come originally from a single fertilized egg, are genetically the same, and form a natural matched pair. A 2003 BBC News report detailed an experiment in which five-year-old identical twin boys were given different diets for a two-week period. One twin continued to eat his normal diet, while the second consumed only food with no additives. The children were given IQ tests before and after the experiment. While the scores beforehand were identical, after the experiment, the child who had no additives outscored his brother. While this experiment lacked replication (and perhaps randomization as well), it demonstrates the use of matched-pair design as applied to twins—one twin served as the control subject and the other as the experimental subject.
The final way in which to conduct a matched-pair study is to use two measurements on the same individual as the pair. A researcher might pair a measurement before a treatment with one after treatment, or measure the same characteristic by two different methods. Recording a student’s scores on the SAT before and after taking a prep course would be an example of the first type of study, while an individual’s scores from two different IQ tests would be an example of the second.
Question 2.4
For each study described, determine
(a) the control and experimental groups;
(b) whether the experiment used a block design;
(c) whether the experiment used a matched-pair design.
(2) (a) The control group was the three plots receiving the usual atmospheric CO2. The experimental group was the three plots receiving the elevated CO2. (b) The experiment was not a block design. (c) The experiment was not a matched-pair design.
(3) (a) This study compared three treatments. The students who took the standard courses (Business English and General English) were the control group. The experimental group was the students enrolled in the test preparation course. (b) The experiment was a block design, because two different groups of students (majors and non-majors) were treated separately. (c) This was not a matched-pair design.
2.2.3 Ethical Considerations in Studies
Whenever a study involves living subjects, there are questions about the ethics of the design. Are animals being treated humanely, or are human subjects receiving appropriate medical treatment? What level of risk is acceptable in the pursuit of scientific or medical advances?
A medical or health-related study on human subjects is generally referred to as a clinical trial. The federal government has strict guidelines about clinical trials; these are designed to protect the participants in the studies. The website clinicaltrials.gov, a service of the National Institutes of Health, gives a wealth of information about clinical trials in general, and about trials in progress in the U.S. and abroad.
One important feature of a clinical trial is informed consent, the process by which the details of the study are explained to a potential participant. These details include the purpose of the study, its length, required procedures, potential benefits, and risks. A person agreeing to participate in the clinical trial signs an informed consent document. The subject is also entitled to further information throughout the study, and may withdraw at any time.
But difficulties can arise even from such a beneficial policy. How are improvements made in emergency or trauma care when patients are unable to provide informed consent? In 1996, the U.S. Food and Drug Administration adopted CFR §50.24 (revised in 2006) which regulated exceptions from informed consent for emergency research when the subject, a family member, or legal representative cannot provide consent. This regulation requires that the patient’s condition is life-threatening, available treatments are unproven or unsatisfactory, evidence supports the potential benefit to the patient, and the risks are reasonable with regard to the patient’s condition and both standard and experimental treatments. A further requirement is that the public be notified that such a trial will be taking place in their community, and that they are given a specific procedure for “opting out” of the trial in advance of any emergency situation. A 2007 press release from the University of Michigan Health System explained the federal regulation, and described two studies proposed by UMHS researchers.
Difficulties may also arise when investigators compare an experimental treatment to a placebo, rather than to a standard treatment. Researchers at the University of Chicago examined all clinical asthma trials involving children conducted between 1998 and 2001. They concluded that placing children in the placebo arm of a clinical trial is harmful to the subjects, and therefore unethical.
And what about the role of placebos in ordinary health care? Should physicians prescribe placebos to their patients? Should parents give placebos to their children?
Sometimes as a clinical trial proceeds, researchers find evidence that the experimental treatment is causing serious adverse effects, and terminate the study early. In 2002 the National Institutes of Health stopped a study involving 16,000 women taking hormone replacement therapy. The clinical trial was scheduled to continue three more years, but scientists discovered increased risk of breast cancer, strokes, and heart attacks from long-term use of the therapy.
Read one or more of the articles concerning clinical trials, placebos, and ethics that are linked above; then click here to discuss.
The video StatClips: Types of Studies summarizes the characteristics of experiments and observational studies, and provides examples of each type.
Both experiments and observational studies provide us with data that we can use to investigate questions about the world around us. Each type of study has its advantages and disadvantages. We have noted that experiments allow us to draw conclusions about cause-and-effect relationships, while observational studies yield only conclusions concerning the association between two variables. This would suggest that experiments are preferable, but they are not always possible due to ethical or practical considerations. Whatever the study, the results we obtain are always determined to some degree by chance.
2.3 Random Samples
In the first two sections of this chapter, we discussed the importance of randomization in observational studies and experiments. In this section, we will consider how to achieve this randomization. In particular, we will look at the process of selecting a simple random sample.
2.3.1 Types of Random Samples
When selecting a sample to use in a study, we use randomization because it provides us the best chance of obtaining a sample that is representative of the characteristics of the population. If you were asked to describe what would make a sample random, you might say that every individual in the population should have an equal chance of being selected. That is certainly a good place to start.
Suppose that a statistics professor goes crazy and decides to give A’s to four students randomly selected from the 28 individuals enrolled in her class. She might write each person’s name on a slip of paper, put the names in a hat, and have an impartial observer draw four names from the hat. The students whose names are selected will receive the A’s—no work required!
The video StatClips: Data and Sampling provides examples illustrating the difficulty of selecting simple random samples.
A sample selected in this fashion satisfies the criterion that every individual has an equal chance of being selected. In addition, this method allows every possible combination of four students to be selected—and each combination is equally likely to be selected. A sample selected in such a way that every sample of the desired size is equally likely to be chosen is called a simple random sample (SRS).
The statistical procedures that we will consider later in this course require that our samples be simple random samples so we are primarily concerned with them. But there are other methods that also generate random samples; we now present several of the simpler ones.
Let’s return to the deranged professor giving out A’s, and look at a way to select the sample of four students systematically. Since there are 28 students in the class, and a sample of four is required, she could choose one of the first seven students from her alphabetical roll list, and then every seventh student thereafter. The randomization comes in by choosing where to start the selection; as long as the first student is chosen at random, each student has an equal chance of being selected. This method does not, however, produce a simple random sample, because all samples of size 4 are not equally likely. Some samples are impossible to obtain, such as those which have two names that are alphabetically adjacent in the list. (Systematic sampling does not require that the sample size divide evenly into the population size, but since we will not be selecting samples by this method, we will omit the details of such selections here.)
While we use “sampling frame” to mean the list of individuals in the population, the term is sometimes used to describe how the sample selected relates to the underlying population. Researchers investigating burnout in athletic trainers used the membership list of the National Athletic Trainers’ Association to select a stratified random sample. Strata used were gender, type of institution, and years of experience. Their sampling frame displays the numbers and percentages of individuals selected from each stratum.
Now consider a situation in which the population consists of individuals that can be divided into groups according to one or more characteristics; a representative sample of such a population should include individuals from each subgroup, in approximately the same proportion that they appear in the population. A stratified random sample is obtained by first dividing the population into groups (strata) defined by one or more variables, and then selecting a simple random sample from each group. For example, suppose a community college offers classes during the day, in the evening, and on the weekend. The director of the campus tutoring center wants to conduct a survey to determine the best hours to be open in order to serve the student population. He should use a stratified random sample to assure that students who attend classes at different times are adequately represented.
Pollsters often also use a stratified random sample when they are interested in predicting the winner of a presidential race. Typically, national surveys involve approximately 1000 people (we’ll see why this is the case later) so one might think that the 1000 voters are randomly selected from the entire population of eligible voters. In fact, pollsters do not randomly pick 1000 phone numbers because voting patterns vary by region and state.
Instead, they will often use previous elections to determine the percentage of people who voted in each geographical region. For example, in a previous election, if 23% of votes came from the East, 26% from the South, 31% from the Great Lakes/Central region, and 20% from the West, they would make 23% of the 1000 calls (or 230) to the East, 260 to the South, 310 to the central region, and 200 to the West. In addition, voter turnout by state is also used to make sure that each state in a particular region is getting the right number of calls.
Unlike a stratified random sample, in which the groups are different, a cluster sample first divides the population into groups (clusters) that are similar. A set of clusters is then randomly chosen, and a census of the individuals in each selected cluster is conducted. If the director of food service at a large university wants to gauge student opinion about menu choice in dormitories, she could select some of the university’s dormitories at random, and then survey each student residing in those dorms. The clusters here are determined by geography; all students residing in a particular dorm constitute a cluster.
Cluster samples are often used in market research studies, and are particularly useful in the situation where a complete list of people in the population is not available. Cluster samples can also be used to reduce costs associated with polling; if the population is concentrated in clusters such as neighborhoods or schools, several interviews can be conducted much more quickly than interviews performed in spread out areas.
When very large samples are involved, organizations typically use a combination of techniques, often using several stages and types of random sampling. These samples are called multistage samples. Because the census of American households occurs only every ten years, the Census Bureau conducts the American Community Survey (ACS) yearly in order to provide updates about how communities are changing. The ACS is used to inform decisions about policies and programs, and to determine how billions of dollars of federal funds are distributed. The ACS Design and Methodology Paper describes in great detail the multistage sampling procedure used in the survey. Merely reading the table of contents of the report reveals many of the issues about sample surveys that we have raised in this chapter.
The random digit dialing typically used in social research polls and surveys also involves multistage sampling. One stage selects the first six or eight digits of the phone number, and the final four or two digits of the number are dialed at random.
2.3.2 Selecting a Simple Random Sample Using a Table
While our “names in the hat” method produces a simple random sample, it is not an efficient way to choose an SRS if the population is large. Choosing a simple random sample in this case requires a list of all individuals in the population (the sampling frame) and a way to pick them out of the list at random. One way to do this is to attach a different numerical label to each individual. A random number “finder,” either a table or statistical software, is then used to select as many numbers as needed for the desired sample size.
When using a random number table, the sampling frame is numbered so that each individual has a unique label with the same number of digits. For example, to label a population of 100 individuals, we could use the numbers 00 through 99, the numbers 001 through 100, or even the numbers 5033 through 5132. (More about which one we want to pick shortly.)
Below is a portion of the random digits table available in the Resources section of this course.
| 123 | 54580 | 81507 | 27102 | 56027 | 55892 | 33063 | 41842 | 81868 |
|---|---|---|---|---|---|---|---|---|
| 124 | 71035 | 09001 | 43367 | 49497 | 72719 | 96758 | 27611 | 91596 |
| 125 | 96746 | 12149 | 37823 | 71868 | 18442 | 35119 | 62103 | 39244 |
| 126 | 96927 | 19931 | 36809 | 74192 | 77567 | 88741 | 48409 | 41903 |
| 127 | 43909 | 99477 | 25330 | 64359 | 40085 | 16925 | 85117 | 36071 |
| 128 | 15689 | 14227 | 06565 | 14374 | 13352 | 49367 | 81982 | 87209 |
| 129 | 36759 | 58984 | 68288 | 22913 | 18638 | 54303 | 00795 | 08727 |
| 130 | 69051 | 64817 | 87174 | 09517 | 84534 | 06489 | 87201 | 97245 |
| 131 | 05007 | 16632 | 81194 | 14873 | 04197 | 85576 | 45195 | 96565 |
| 132 | 68732 | 55259 | 84292 | 08796 | 43165 | 93739 | 31685 | 97150 |
In the leftmost column are the line numbers, which provide a way to identify our starting point. The remainder of the table consists of a long list of random digits. The digits are separated into rows and columns only for ease of reading them. Each digit 0 to 9 is equally likely to appear in any space, and there is no relationship between any of the entries.
Once we have a starting place, we read from the table consecutive digits of the length needed. Starting in the third column of row 127, we find the first ten numbers of these lengths:
2 digits: 25, 33, 06, 43, 59, 40, 08, 51, 69, 25
3 digits: 253, 306, 435, 940, 085, 169, 258, 511, 736, 071
4 digits: 2533, 0643, 5940, 0851, 1692, 5851, 1736, 0711, 5689, 1422
Notice that we ignore any row or column boundaries in selecting the numbers, but we do not use the line labels.
Let’s return to the question of which labeling scheme we should use for the population if we want to select an SRS of 10 individuals from a population of 100. Look carefully at the 2-digit, 3-digit, and 4-digit numbers generated above. We can see that if we label the population 00 to 99, the 2-digit row provides us with 9 individuals for the sample. The label 25 was selected twice, so we must choose the next unique 2-digit number from the table to complete the sample. Of course, these numbers are not themselves the sample; rather, they are the labels that identify the individuals who will make up then sample.
If we had labeled the population 001 to 100, only two of the 3-digit numbers generated (085 and 071) correspond to labels for the population. We would have to continue searching the table to find 8 more numbers in the correct range. And if, for whatever reason, we had labeled the population 5033 through 5132, none of the 4-digit numbers generated corresponds to a population label. It would probably take quite a while to find ten 4-digit numbers between 5033 and 5132.
Our conclusion? The first labeling scheme gets the sample selection done more quickly and easily. In general, we want to use the smallest number of digits possible when labeling the population.
Question 2.5
The table below gives the first names of 12 individuals in a book club.
| Ann | Barb | Carolyn | Elaine | Ginny | Harriet |
|---|---|---|---|---|---|
| Jackie | Jean | Jill | Linda | LouAnn | Martha |
(1) One method is to assign the labels 00 through 11 to the individuals. Since the names are in alphabetical order, you could make the numerical order coincide with the alphabetical order:
| Ann 00 | Barb 01 | Carolyn 02 | Elaine 03 | Ginny 04 | Harriet 05 |
|---|---|---|---|---|---|
| Jackie 06 | Jean 07 | Jill 08 | Linda 09 | LouAnn 10 | Martha 11 |
Many other assignments are also possible.
(2) Starting in the fourth column of line 123 and selecting 2-digit numbers, we get the numbers 56, 02, 75, 58, 92, 33, 06, 34, 18, 42, 81, 86, 87, 10, 35, 09, 00, 14, . . . . The first four numbers between 00 and 11 inclusive are 02, 06, 10 and 09.
(3) Using the assignment scheme from part (1), the individuals selected are Carolyn, Jackie, LouAnn and Linda.
2.3.3 Selecting a Simple Random Sample Using Software
Using a table of random digits is a higher-tech way to generate random numbers than picking individual names from a hat. Perhaps even easier is to use statistical software that allows you to generate a set of random numbers in a certain interval, or—better yet—to select a sample directly from the sampling frame. The table below shows the book club list from the Try This! example stored in column 1 as var1, and then a randomly selected sample of size 4 stored in column 2 as Sample(var1) 2.
| var1 | Sample(var1) |
| Ann | Ginny |
| Barb | Jean |
| Carolyn | Carolyn |
| Elaine | Kitty |
| Ginny | |
| Jackie | |
| Jean | |
| Jill | |
| Kitty | |
| Linda | |
| LouAnn | |
| Martha |
If your sampling frame is already stored in a spread sheet, this is a very nice way to select a sample.
Question 2.6
Use statistical software to select a sample of 10 whole numbers between 37 and 83 inclusive. If your software allows you to select both with and without replacement, choose a sample each way. (Your software will probably allow you to create the sequence of numbers that constitutes the sampling frame. If it does not, the file Sample from numbers contains these values.)
How random are the numbers generated by statistical software? Random enough for our purposes. Technically, the numbers obtained from most random number generators are called pseudo-random numbers, because they are obtained from a mathematical formula that has a certain starting value (called a seed). So if you have the formula and the seed, you can reproduce the selection of numbers. There are sources on the internet that generate true random numbers; the website http://www.random.org has a true random number generator, and a nice discussion of randomness.
Any process used to select a simple random sample can also be applied to assigning individuals to treatment groups in experiments. Suppose that the book club discussed earlier decides that, instead of all reading the same book as they usually do, half of the club will read one book, and half another. The members decide to assign individuals to one of the two books at random. Since six members will read each book, we can choose an SRS of size 6 from the club, and assign them to the first book. The remaining six members would then read the second book.
This same method works regardless of the number of individuals involved in the experiment, or the number of treatments administered. If the individuals need to be randomized into more than two treatments, those to be given the first treatment are selected, and the process is repeated for assignment to additional treatments. In order to make the selection of subsequent groups easier, individuals already assigned to a treatment group should be removed from the sampling frame.
As we proceed through this course, we will see the critical role that simple random samples play in the types of inference we will study. Although we will not generally select the samples, it is important to understand how such selections are made.
Chapter 2 Summary
In this chapter we looked at how to obtain data from either an observational study or an experiment. Our focus was on study design, randomization and sample selection, and drawing conclusions. Recall that with an observational study, members of the population are merely observed while with an experiment, there is some type of treatment imposed on the subjects.
With an observational study we are interested in the survey design. How was the data collected - via a survey, an interview, or by observation? We also would like to know how the sample was selected. Was randomization part of the process? Recall that randomization is the use of impersonal chance to select individuals to study or to assign individuals to treatment groups. If the subjects are not randomly selected, bias may be introduced. Bias is the predisposition of a study toward certain results; it is caused by problems in the study design or sample selection. If we want to obtain a sample that best represents the population, randomization gives us the best chance of accomplishing this goal. Selecting a sample which best represents the population begins with identifying the sampling frame, which is a list of the individuals in the population.
Even if randomization is part of the study, other forms of bias are possible. Response bias is any aspect of the design that influences the participants’ response. Another form of bias is undercoverage, which is underrepresentation in the sample of a group or groups of individuals in the population. Nonresponse bias occurs when members selected for the sample do not actually participate, and finally, voluntary response occurs when individuals choose to answer a particular question.
In reporting the results of a poll or survey it’s important to specify the summary statistics, sample sizes, and margin of error. The margin of error is a number that estimates (with all likelihood) how far the desired parameter could be from the reported statistic.
In many studies there will be at least one explanatory variable and response variable. An explanatory variable is the variable that explains or predicts the values of the response variable whereas the response variable is the outcome that we are investigating. Although an observational study can provide useful information about the association between the explanatory and response variables, it cannot provide cause and effect between them because there may be other variables (lurking variables) at play. A lurking variable is a characteristic of the sample that is not investigated as part of the study, but which may influence the results. Confounding is the inability to distinguish the effects of the explanatory and lurking variables on the response variable.
If you are interested in establishing cause and effect then you need to perform an experiment. Often experiments involve a placebo which is an inactive treatment that has no medical effect. The placebo serves as the control treatment, a treatment that is used to establish cause and effect. A well-designed experiment should involve three critical properties: control, randomization, and replication. In addition, often an experiment is double-blind. A double-blind study is one in which neither the individuals receiving the treatment nor those administering the treatments (or interpreting them) know which group of individuals are in the treatment and control groups.
The simplest experimental design involves randomly assigning the subjects to treatment groups and then comparing the values of the response variables. More sophisticated designs, including block design and matched pairs, are often utilized. A block is a group of individuals that share one or more characteristics. With a block design, individuals are separated according to some characteristic, before each block is divided into treatment groups. Matched-pair design is used to control for variables not studied. Two individuals matched according to important characteristics are paired, with one individual assigned to the first treatment and the other to the second treatment.
If after the experiment is conducted there is a difference among the treatment groups so large that they are unlikely to merely have occurred by chance, we say that the results are statistically significant.
Finally, there are ethical considerations that need to be addressed in a clinical trial, a medical study on human subjects. One important component of a clinical trial is informed consent, which is the process by which details of the study are explained to a potential participant.
Watch the white-board example StatClips: Data and Sampling Example C to see how to select a random sample from a table.
In both observational studies and experiments, we have seen that randomization is a key component. So how does one go about generating a random sample? A sample selected such that every individual has an equal chance of being selected and allows every possible combination of a particular fixed size to be selected, is called a simple random sample (SRS). More complicated sample designs also exist and two particular examples are a stratified random sample and a cluster sample. A stratified random sample is obtained by first dividing the population into groups (strata) defined by one or more variables, and then selecting a simple random sample from each group. Unlike a stratified random sample, in which the groups are different, a cluster sample first divides the population into groups (clusters) that are similar. A set of clusters is then randomly chosen, and a census of the individuals in each selected cluster is conducted.