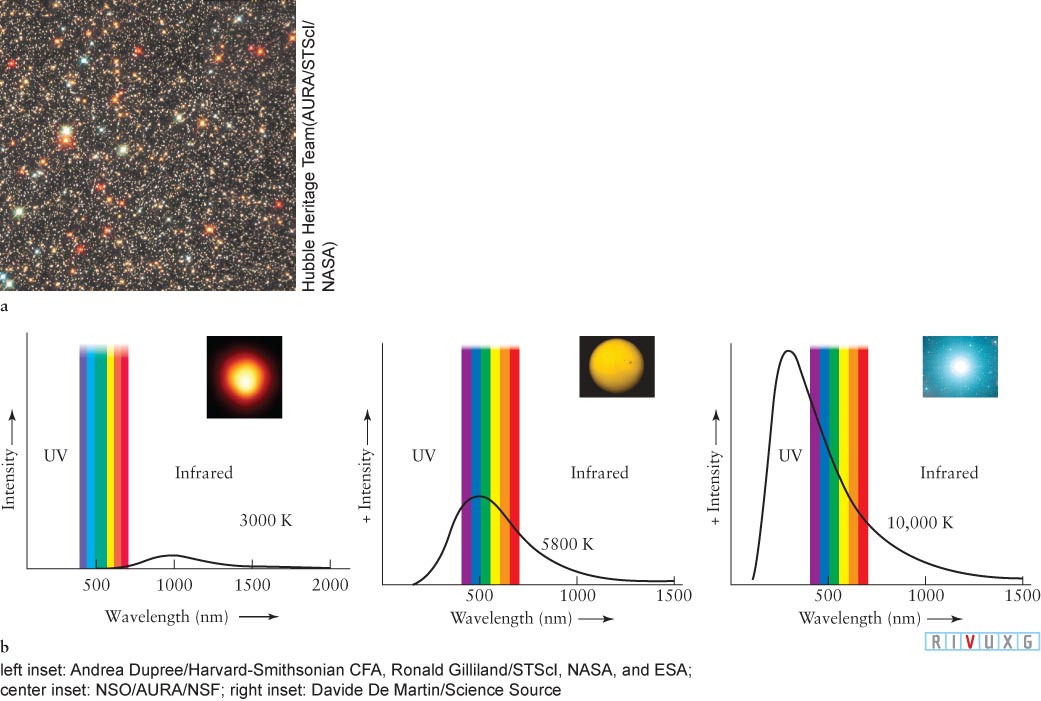
Figure 10-4Temperature and Color (a) This beautiful Hubble Space Telescope image shows the variety of colors of stars. (b) These diagrams show the relationship between the color of a star and its surface temperature. The intensity of light emitted by three stars is plotted against wavelength (compare with Figure 3-42). The range of visible wavelengths is indicated. The location of the peak of each star’s intensity curve, relative to the visible-light band, determines the apparent color of its visible light. The insets show stars of about these surface temperatures. Ultraviolet (UV) extends to 10 nm. See Figure 3-7 for more on wavelengths of the spectrum.