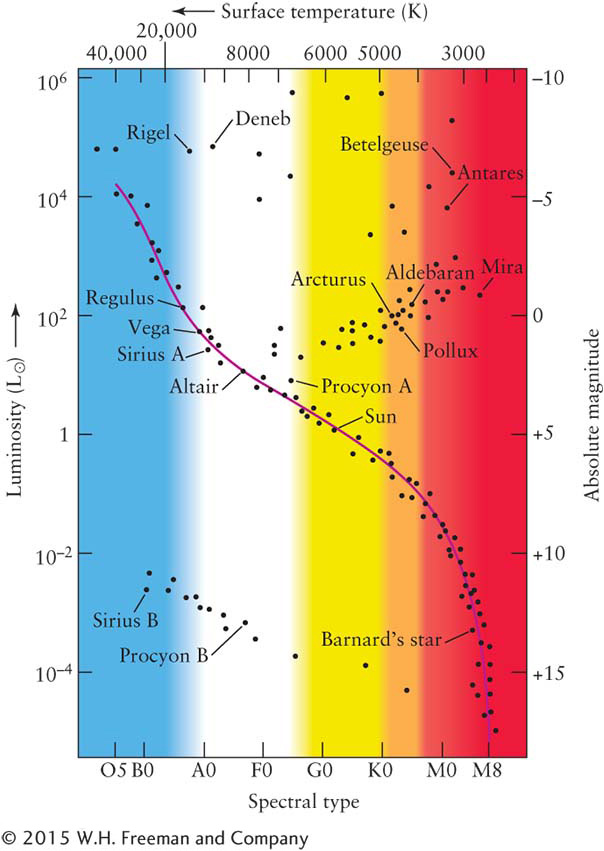
Figure 10-7A Hertzsprung-Russell Diagram On an H-R diagram, the luminosities of stars are plotted against their spectral types. Each dot on this graph represents a star whose luminosity and spectral type have been determined. Some well-known stars are identified. The data points are grouped in just a few regions of the diagram, revealing that luminosity and spectral type are correlated: Main-sequence stars fall along the red curve, giants are to the right, supergiants are on the top, and white dwarfs are below the main sequence. The absolute magnitudes and surface temperatures are listed at the right and top of the graph, respectively. These are sometimes used on H-R diagrams instead of luminosities and spectral types.