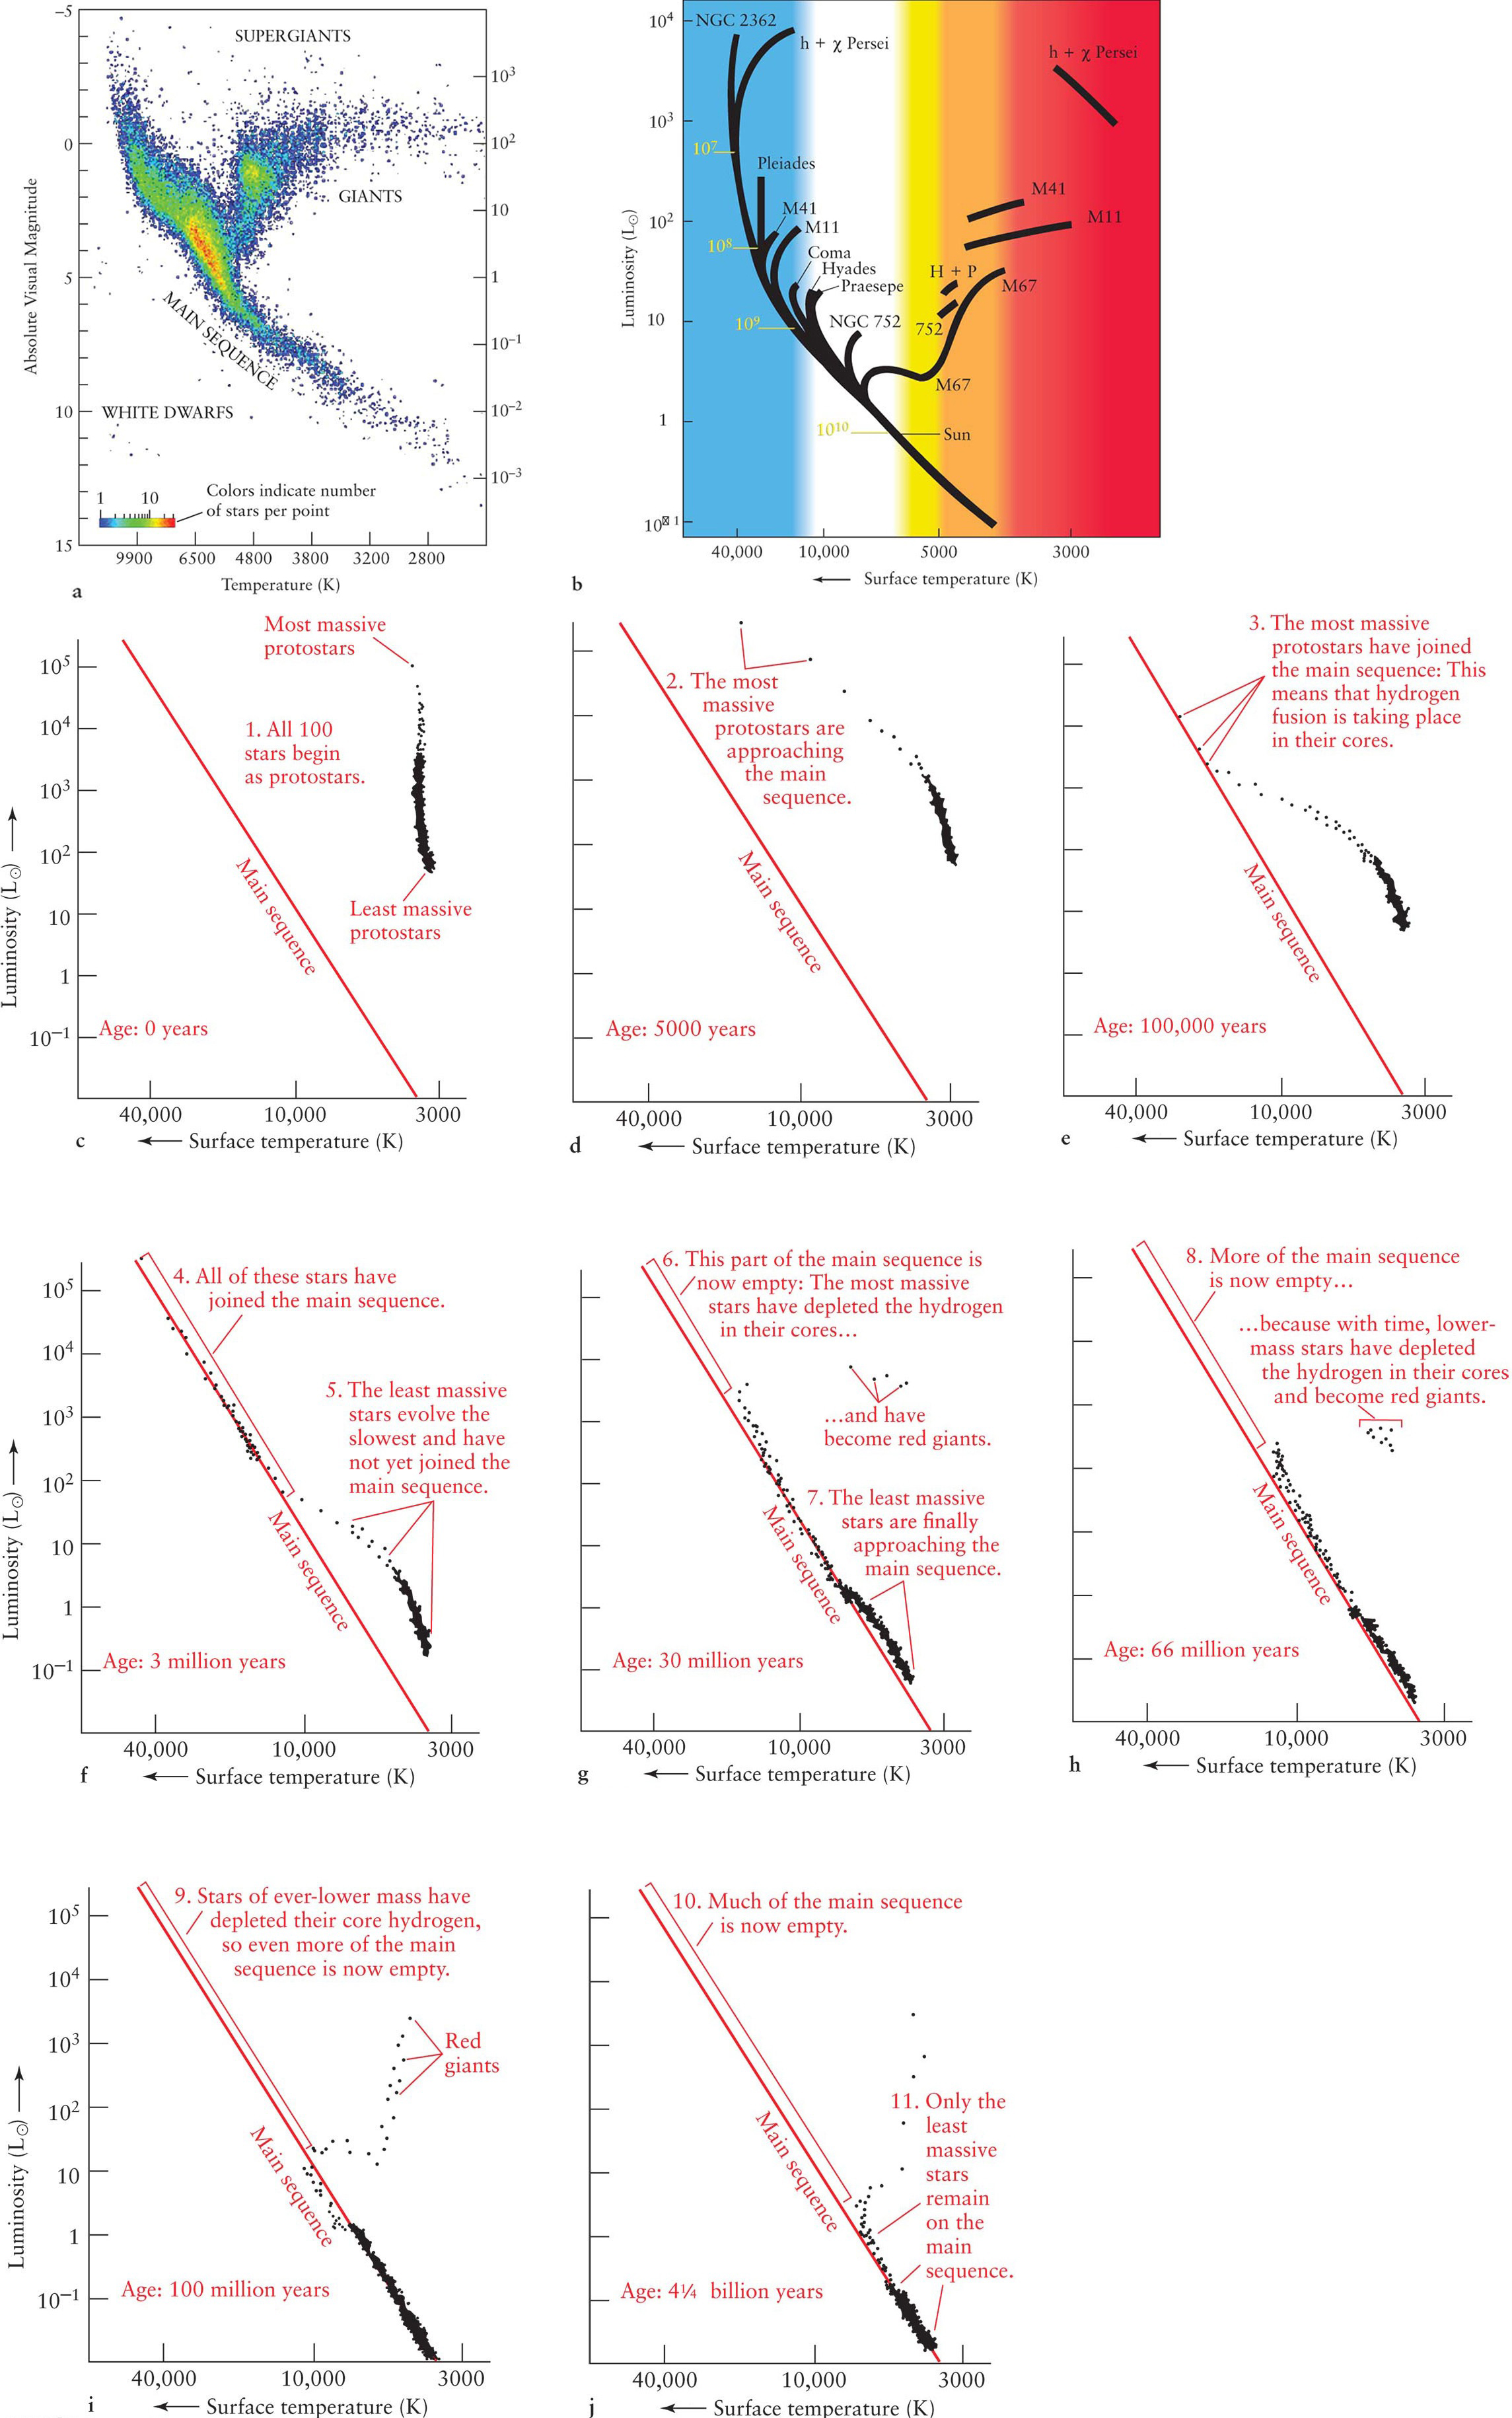
Figure 11-28Structure of the H-R Diagram (a) Data taken by the Hipparcos satellite placed 41,453 stars more precisely on the H-R diagram than any previous observations. This figure shows the overall structure of the H-R diagram. The thickness of the main sequence is due in large part to stars of different ages turning off the main sequence at different places, as shown in (b). (b) The black bands indicate where data from various star clusters fall on the H-R diagram. The ages of turnoff points (in years) are listed in yellow alongside the main sequence. The age of a cluster can be estimated from the location of the turnoff point, where the cluster’s most massive stars are just now leaving the main sequence. (c–j) The evolution of a theoretical cluster of 100 stars is summarized, as shown by their locations on the H-R diagram. (In principle, each star’s evolution could be followed separately.) After a star passes through the red giant phase, it is deleted from the diagram.