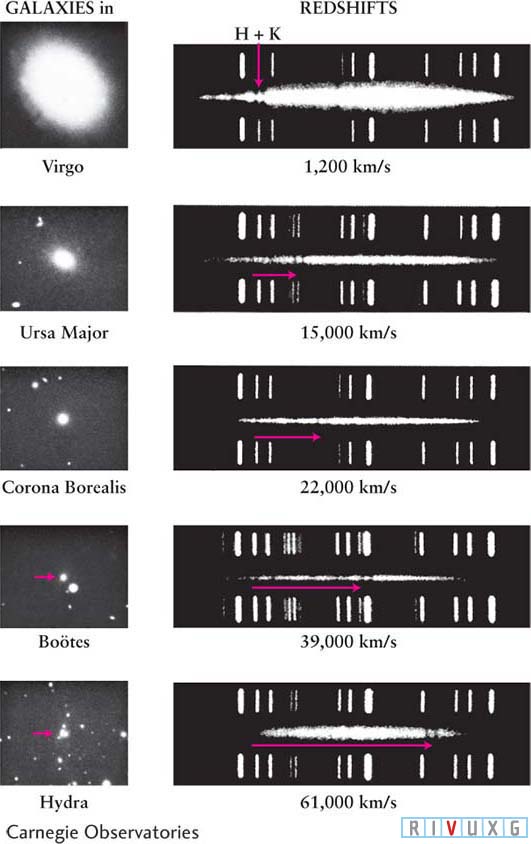
Figure 13-49 Five Galaxies and Their Spectra The photographs of these five elliptical galaxies were all taken at the same magnification. They are labeled according to the constellation in which each galaxy is located. The spectrum of each galaxy is the hazy band between the comparison spectra at the top and bottom of each plate. In all five cases, the so-called H and K lines of calcium are seen. The recessional velocity (calculated from the Doppler shifts of the H and K lines) appears below each spectrum. Note that the fainter—and thus more distant—a galaxy is, the greater is its redshift.