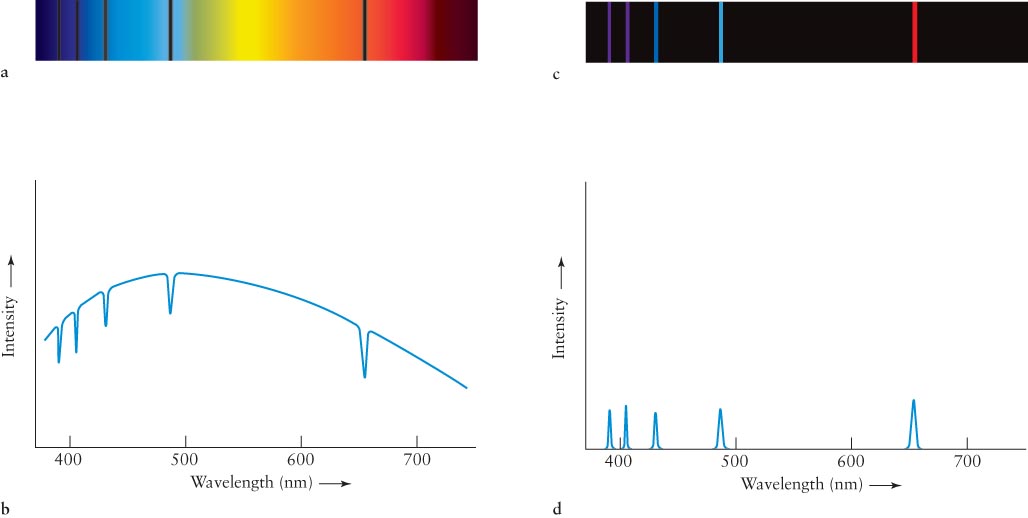
Figure 3-48Spectrum of Hydrogen Gas (a) When a CCD is placed at the focus of a spectrograph, the spectrum is recorded. I n this case, the spectrum is from a hot object whose light shines through hydrogen gas. (b) This spectrum is converted by computer into a graph of intensity versus wavelength. Note that the absorption lines appear as dips in the intensity-versus-wavelength curve. Conversely, when a gas emits only a few wavelengths, (c) its emission spectrum appears as a series of bright lines, which is converted into peaks (d) on a graph of intensity versus wavelength.