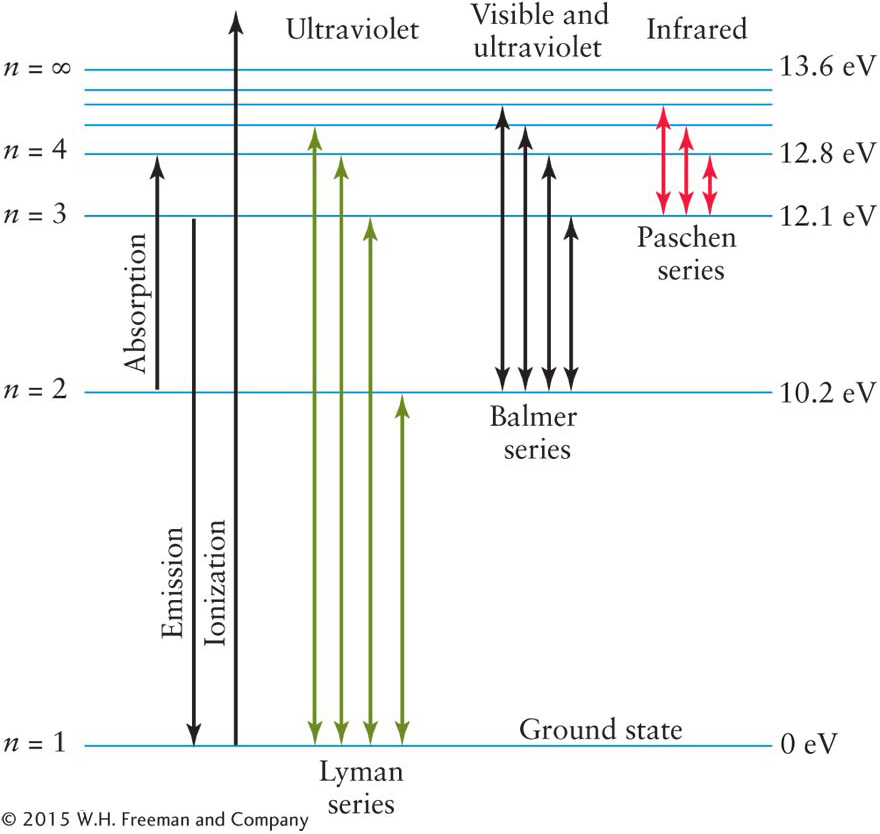
Figure 3-51Energy Level Diagram of Hydrogen The activity of a hydrogen atom’s electron is conveniently displayed in a diagram showing some of the energy levels, labeled n, at which the electron can exist. Various electron jumps, or transitions, are also shown, including those that produce the most prominent lines in the hydrogen spectrum.