10-7 The Hertzsprung-Russell diagram identifies distinct groups of stars
Focus Question 10-6
Which star is hottest: F5, B6, or M3?
Around 1911, the Danish astronomer Ejnar Hertzsprung noticed that patterns emerge when the luminosities of stars (or their equivalent absolute magnitudes) are plotted against their surface temperatures (or their equivalent spectral types). Luminosity and absolute magnitude each indicate the total energy emitted by a star or other body. These two terms provide quantitative measurements in answer to the question: “How bright is that star?” Within two years, the American astronomer Henry Norris Russell independently discovered the same result. Graphs of stellar luminosity or absolute magnitude against surface temperature or spectral type are now known as Hertzsprung-Russell diagrams, or H-R diagrams.
The H-R diagram is valuable because it shows that stars do not have random surface temperatures and luminosities; the two factors are correlated. Figure 10-7 is a typical H-R diagram. Each dot represents a star whose luminosity and spectral type have been determined. The surface temperatures are plotted along the top of this figure and the absolute magnitudes along the right side. You can therefore see the equivalence of the temperature and spectral type and the equivalence of the luminosity and absolute magnitude.
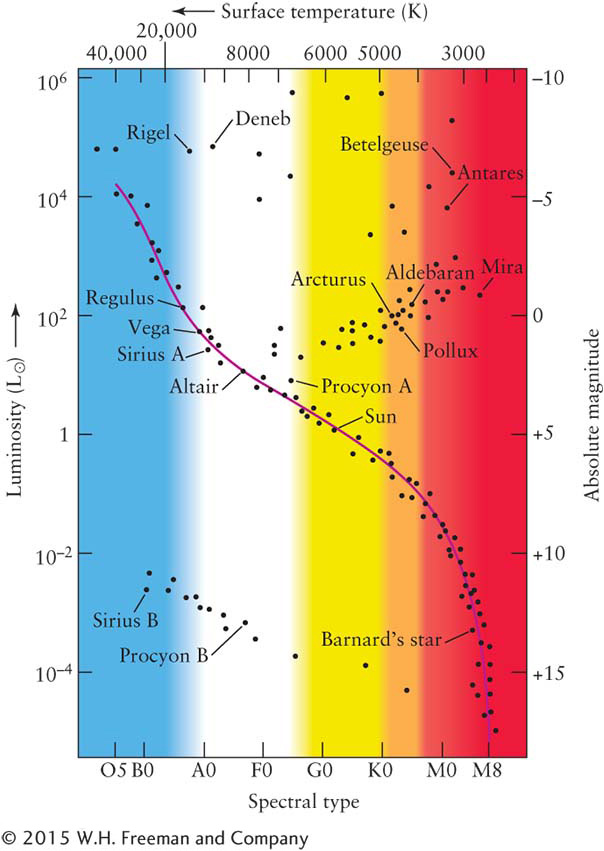
Figure 10-7: A Hertzsprung-Russell Diagram On an H-R diagram, the luminosities of stars are plotted against their spectral types. Each dot on this graph represents a star whose luminosity and spectral type have been determined. Some well-known stars are identified. The data points are grouped in just a few regions of the diagram, revealing that luminosity and spectral type are correlated: Main-sequence stars fall along the red curve, giants are to the right, supergiants are on the top, and white dwarfs are below the main sequence. The absolute magnitudes and surface temperatures are listed at the right and top of the graph, respectively. These are sometimes used on H-R diagrams instead of luminosities and spectral types.
Bright stars are near the top of the diagram; dim stars are near the bottom. Contrary to intuition, hot (O and B) stars are toward the left side and cool (M) stars are toward the right. Hertzsprung and Russell made this choice because of the standard sequence OBAFGKM.
The band of stars in Figure 10-7 stretching diagonally across the H-R diagram and on which a red curve is superimposed represents most of the stars we see in the nighttime sky. Called the main sequence, it extends from the hot, bright, bluish stars in the upper left corner of the diagram down to the cool dim stars (called red dwarfs) in the lower right corner. Each star on this band is a main-sequence star. Just over 91% of the stars surrounding the solar system fall into this category.
Insight Into Science
From Patterns to Models Scientists look at patterns of behavior in related objects as valuable clues to underlying properties and their causes. Guided by these data, they then create mathematical models, which are used to make fresh predictions. For example, astronomers analyze the relationship between the luminosities and surface temperatures of stars as displayed on an H-R diagram to gain insight into the internal activities of stars.
Observations reveal that the number of main-sequence stars decreases with increasing surface temperature. Therefore, along the main sequence, the cooler M, K, and G stars are the most common ones and the hot O stars are the rarest. The Sun (spectral type G2, absolute magnitude +4.8) is a main-sequence star.
 To the right of the main sequence on the H-R diagram is a second major grouping of stars. These stars are bright but cool. From the Stefan-Boltzmann law (see Section 3-13), we know that a cool object radiates much less light from each unit of surface area than does a hot object. To be so luminous, these cool stars must therefore be huge compared to main-sequence stars of the same temperature, so they are called giant stars.
Giants are typically 10 to 100 times the radius of the Sun and have surface temperatures between 2000 and 20,000 K. The cooler members of this class of stars (those with surface temperatures between 2000 and 4500 K) are often called red giants because they appear reddish in the nighttime sky. Aldebaran in the constellation Taurus and Arcturus in Boötes are examples of red giants that you can easily see with the naked eye.
A few rare stars are considerably bigger and more luminous than typical giants. Located along the top of the H-R diagram, these superluminous stars are appropriately called supergiants. They can extend in radius up to about 1000 R⊙. Betelgeuse in Orion and Antares in Scorpius are two examples that are visible in the nighttime sky. Together, giants and supergiants comprise less than 1% of the stars in our vicinity.
 The remaining 8% of stars in our neighborhood of space fall in a final grouping toward the lower left and bottom of the H-R diagram. As their placement on the diagram shows, these stars are hot, dim, and tiny compared to the Sun. Called white dwarfs, we will see that they are actually remnants of stars. White dwarfs are roughly the same size as Earth, and because of their low luminosities, they can be seen only with the aid of a telescope.
The H-R diagram also provides us with enough data to determine a star’s radius. There is a relationship between a star’s luminosity, L, temperature, T, and radius, r: L = σT44πr2, where σ (sigma) is a constant. Knowing two properties, the luminosity and temperature, we can solve this equation for the third, namely, the radius. Lines of constant stellar radii are drawn on Figure 10-8.
These results are summarized in Figure 10-8, where the dashed lines indicate the radii of stars. Notice that most main-sequence stars are roughly the same size as the Sun. It is important to keep in mind that, although the H-R diagram is invaluable in helping astronomers organize stars by their physical properties (temperature and absolute magnitude), the diagrams do not explain the physical mechanisms that produce these characteristics. As we will see shortly, the locations of stars on the H-R diagram provided crucial clues that astrophysicists used in developing and testing their theories of how stars shine.
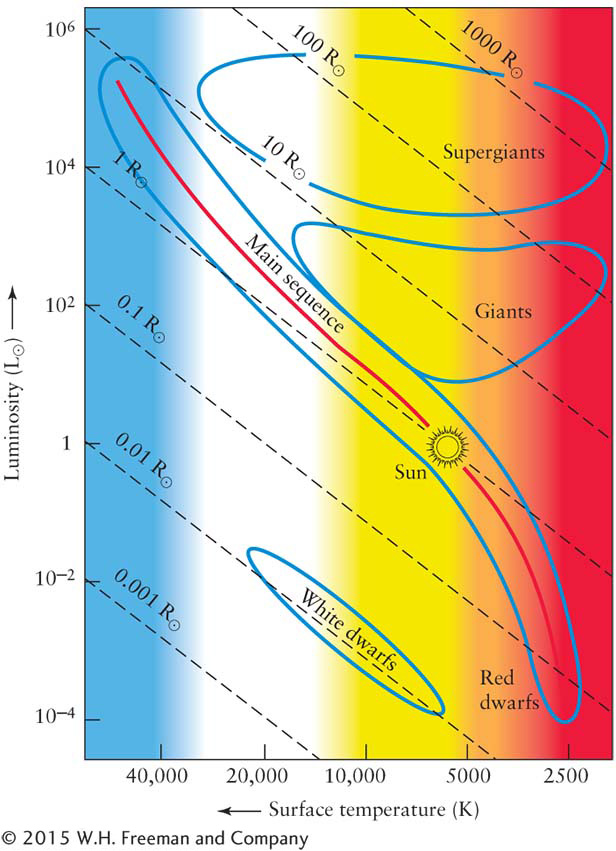
Figure 10-8: The Types of Stars and Their Sizes On this H-R diagram, stellar luminosities are plotted against the surface temperatures of stars. The dashed diagonal lines indicate stellar radii. For stars of the same radius, hotter stars (corresponding to moving from right to left on the H-R diagram) glow more intensely and are more luminous (corresponding to moving upward on the diagram) than cooler stars. While individual stars are not plotted, we show the regions of the diagram in which main-sequence, giant, supergiant, and white dwarf stars are found. Note that the Sun is intermediate in luminosity, surface temperature, and radius; it is very much a middle-of-the-road star.
10-8 Luminosity classes set the stage for understanding stellar evolution
Focus Question 10-7
For a given spectral class (that is, temperature), a star of which luminosity class—main sequence, giant, or supergiant—is brightest?
We have seen that a star’s surface temperature largely determines which lines are prominent in its spectrum. Therefore, as noted in Section 10-6, classifying stars by spectral type is the same as categorizing them according to surface temperature. However, as you can see in Figure 10-8, stars of the same surface temperature can have different luminosities. For example, a star with a surface temperature of 5800 K could be a white dwarf, a main-sequence star, a giant, or a supergiant.
Focus Question 10-8
A main-sequence star of which spectral type—F5, A8, or K0—is largest?
Astronomers have found subcategories in which to place stars by studying their spectral absorption lines in detail. This refined classification is possible primarily because absorption lines are affected by the density and pressure of the gas in a star’s atmosphere, both of which depend on whether the star is a white dwarf, main-sequence star, giant, or supergiant (Figure 10-9).
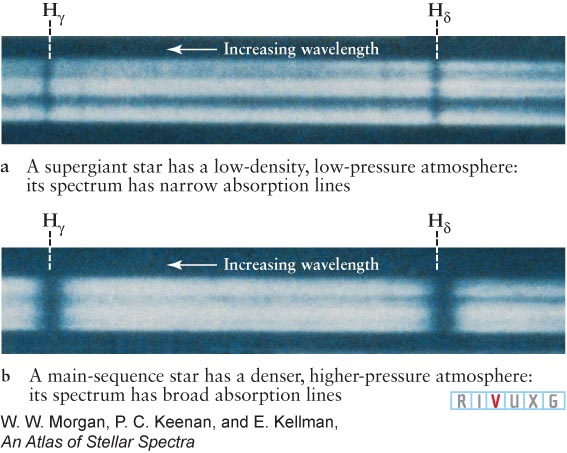
Figure 10-9:  Stellar Size and Spectra These spectra are from two stars of the same spectral type (B8) and, hence, the same surface temperature (13,400 K) but different radii and luminosities: (a) the B8 supergiant Rigel (luminosity 58,000 L⊙) in Orion and (b) the B8 main-sequence star Algol (luminosity 100 L⊙) in Perseus.
Based upon the differences in stellar spectra, W. W. Morgan, P. C. Keenan, and Edith Kellman of the Yerkes Observatory developed a system of luminosity classes in the 1930s. Luminosity classes Ia and Ib encompass all of the supergiants; giants of various luminosity are assigned classes II, III, and IV; and main-sequence stars are luminosity class V. Figure 10-10 summarizes these results. We will explore in Chapter 11 how the different luminosity classes correspond to different stages of stellar evolution. Note on Figure 10-10 that white dwarfs are not given a luminosity class because they are stellar remnants that do not create energy by fusion like the Sun and other stars in the five luminosity classes. We will also study white dwarfs further in Chapter 11.
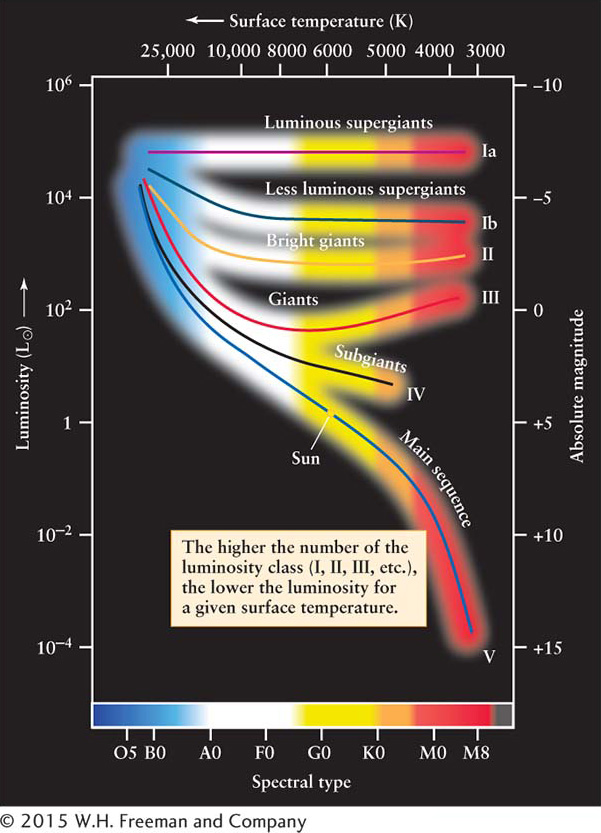
Figure 10-10: Luminosity Classes Dividing the H-R diagram into regions, called luminosity classes, permits finer distinctions between giants and supergiants. Luminosity classes Ia and Ib encompass the supergiants. Luminosity classes II, III, and IV indicate giants of different brightness. Luminosity class V indicates main-sequence stars. Because they do not create energy by fusion, like the other stars we have discussed so far, white dwarfs do not have their own luminosity class.
Plotting luminosity classes on the H-R diagram (see Figure 10-10) provides a useful subdivision of star types. In fact, astronomers commonly describe a star by both its spectral type and its luminosity class. The Sun, for example, is a G2 V star. This notation supplies a great deal of information about the star, because its spectral type is correlated with its surface temperature. Thus, an astronomer knows immediately that a G2 V star is a main-sequence star with a luminosity of 1 L⊙ and a surface temperature of around 5800 K. Similarly, knowing that Aldebaran is a K5 III star tells an astronomer that it is a red giant with a luminosity of around 370 L⊙ and a surface temperature of about 4400 K (see Figure 10-7).
10-9 A star’s spectral type and luminosity class provide a second distance-measuring technique
A star’s spectral type and luminosity class, combined with information from the H-R diagram, give astronomers all the information necessary for determining the distances to stars millions of light-years away, far beyond the maximum distance that can be measured using stellar parallax. The process works like this:
Astronomers observe a distant star’s apparent magnitude and spectrum.
From its spectrum, they determine which spectral class the star belongs to (or, equivalently, its surface temperature).
The spectrum also reveals the star’s luminosity class, that is, whether it is a supergiant, giant, or main-sequence star. Combining the temperature and the luminosity class determines the star’s location on the H-R diagram (see Figure 10-10). From this position, the star’s approximate absolute magnitude can be read off the diagram.
Using the apparent and absolute magnitudes in the distance–magnitude relationship (see Discovery 10-2), the star’s distance can then be calculated.
Consider, for example, the star Regulus in the constellation Leo. Regulus’s spectrum reveals it to be a B7 V star (a hot, blue, main-sequence star). Placing it on the H-R diagram (see Figure 10-7), we see that its luminosity is 140 L⊙ and its absolute magnitude is −0.52. Given the star’s apparent magnitude, we can use the distance–magnitude relationship to determine its distance from Earth. Because both the spectral type and luminosity class are obtained spectroscopically, this method of determining distances is called spectroscopic parallax. (This name is misleading, however, because no parallax angle is involved.)
Spectroscopic parallax is limited in accuracy because of the spread of stars in each luminosity class—the stars in each class do not fall on a single, narrow line (hence, the use of the word approximate in the preceding numbered process). It is also limited because spectra of distant stars become increasingly hard to determine. As a result, errors of 10% in distance are common using spectroscopic parallax. Accepting such errors, the power of this method is that it can be used for stars at much greater distances than those determined by stellar parallax. Indeed, this method even provides distances to stars in other galaxies tens of millions of light-years away.