IDENTIFYING THE ELEMENTS BY ANALYZING THEIR UNIQUE SPECTRA
In 1814, the German optician Joseph von Fraunhofer repeated Newton’s classic experiment of shining a beam of sunlight through a prism (recall Figure 3-
By the mid-
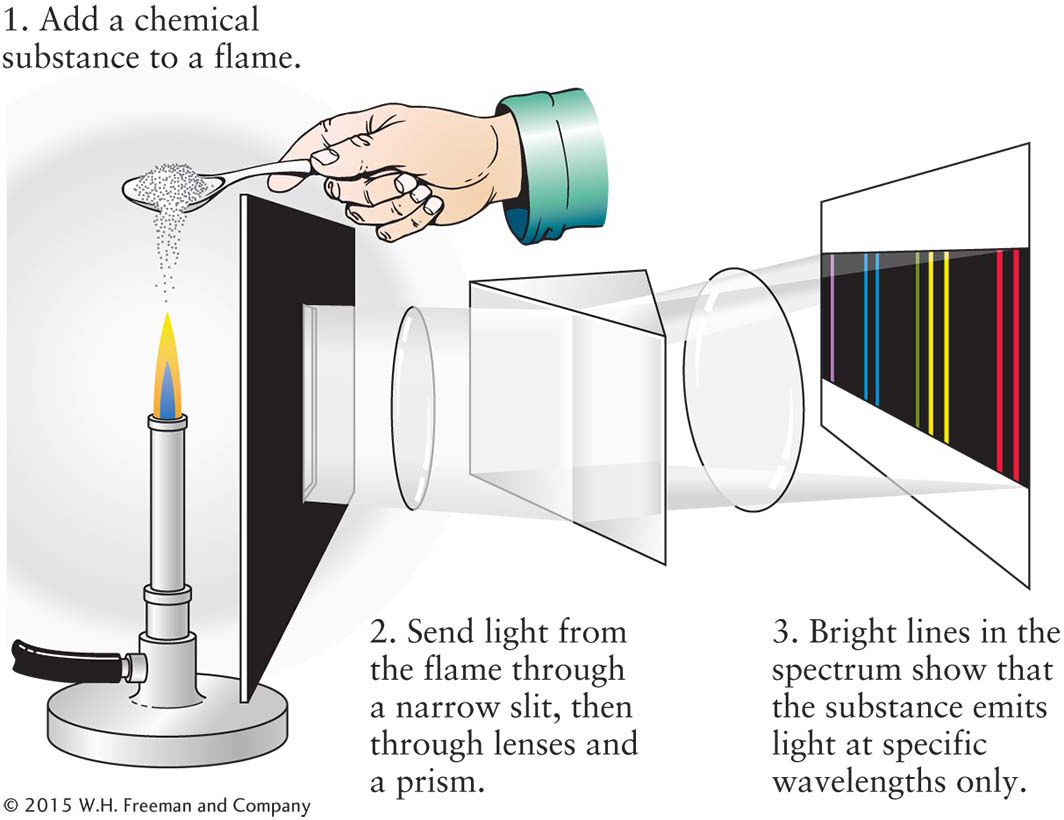
Bunsen’s colleague Gustav Kirchhoff suggested that light from the colored flames could best be studied by passing it through a prism. By separating the colors, the chemists could see exactly which ones were present. The process of analyzing the spectrum of an object is called spectroscopy. Bunsen and Kirchhoff collaborated in designing and constructing the first spectroscope. This device consists of a narrow slit, a prism, and several lenses that straighten the light rays and magnify the spectrum so that it can be closely examined (Figure 3-
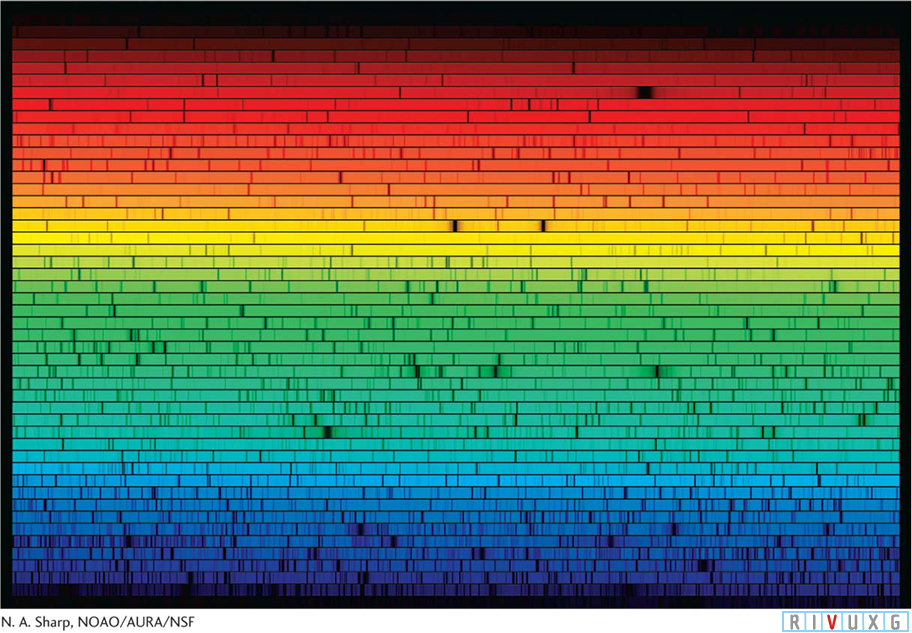
 Solar Spectrum Starlight passing through a prism or diffraction grating spreads into its component colors. From such spectra we can learn an incredible amount about stars, including their masses, surface temperatures, diameters, chemical compositions, rotation rates, and motions toward or away from us. This image, called a spectrogram, shows the spectrum of the Sun sliced and stacked to fit on this page. In it you can see thousands of absorption lines. As you study spectra, also note the distinct differences between the intensities of the various colors emitted by each star and by different stars.
The chemists discovered that the spectrum from a chemical heated by a flame consists of a pattern of thin, bright spectral lines, called emission lines, against a dark background (not a blackbody spectrum!). They next found that the number of lines produced and their colors are unique to the element or compound heated to produce them. Thus, in 1859, the technique of spectral analysis, the identification of chemical substances by their spectral lines, was born.
3-14 Each chemical element produces its own unique set of spectral lines
A chemical element is a fundamental substance that cannot be broken down into more basic units while still retaining its properties. By the mid-
After Bunsen and Kirchhoff recorded the prominent spectral lines of all of the known elements, they began to discover other spectral lines in mineral samples. In 1860, for example, they found a new line in the blue portion of the spectrum of mineral water. After chemically isolating the previously unknown element responsible for the line, they named it cesium (from the Latin caesius, meaning “gray-
85
During a solar eclipse in 1868, astronomers found a new spectral line in the light coming from the upper atmosphere of the Sun when the main body of the Sun was hidden by the Moon. This line was attributed to a new element, which was named helium (from the Greek helios, meaning “sun”). Helium was not actually discovered on Earth until 1895, when it was identified in gases obtained from a uranium compound.
The chemical elements are most conveniently displayed in the form of a periodic table (Appendix N: Periodic Table of the Elements). In addition to the 92 naturally occurring elements, there are artificially produced ones. All of the human-
During some experiments, Bunsen and Kirchhoff examined the blackbody spectra of hot sources whose light they passed through cooler gas. Instead of seeing a continuum of wavelengths, as they would have seen had the cool gas not been there, they saw dark absorption lines among the colors of the rainbow created by the hot source. (This phenomenon is what Fraunhofer had seen earlier from the Sun—
Because each chemical element produces its own unique pattern of spectral lines, scientists can determine the chemical composition of a remote astronomical object by identifying the lines in its spectrum. For example, Figure 3-
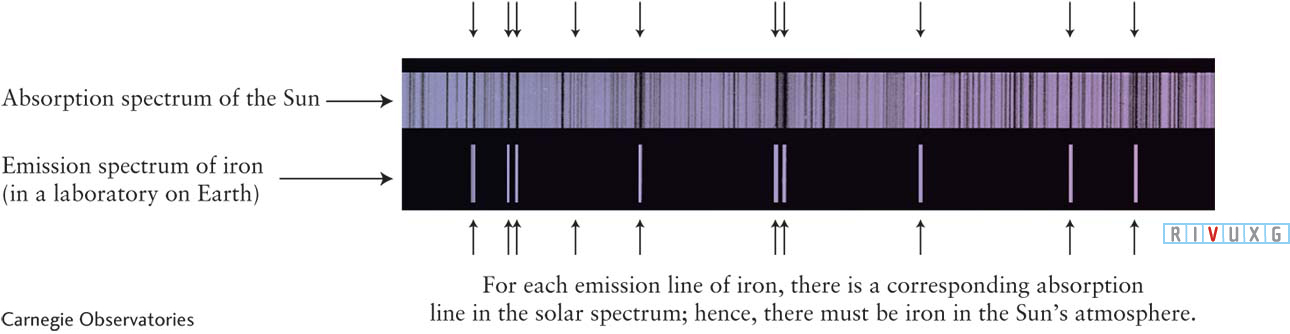 Iron in the Sun’s Atmosphere The upper ( absorption) spectrum is a portion of the Sun’s spectrum from 425 to 430 nm. Numerous dark spectral lines are visible. The lower (emission) spectrum is a corresponding portion of the spectrum of vaporized iron. Several emission lines can be seen against the black background. The iron lines coincide with some of the solar absorption lines, proving that there is some iron (albeit a very tiny amount) in the Sun’s atmosphere.
After photography was invented, scientists preferred to do spectroscopy by making a permanent photographic record of spectra. A device for photographing a spectrum is called a spectrograph, and this instrument, in its numerous variations, is the astronomer’s most important tool.
In its earliest form, a spectrograph was attached directly to a telescope. It consisted of a slit, two lenses, and a prism arranged to focus the spectrum of an object on film, similar to the device sketched in Figure 3-
Practical spectrographs used in research today (shown conceptually in Figure 3-
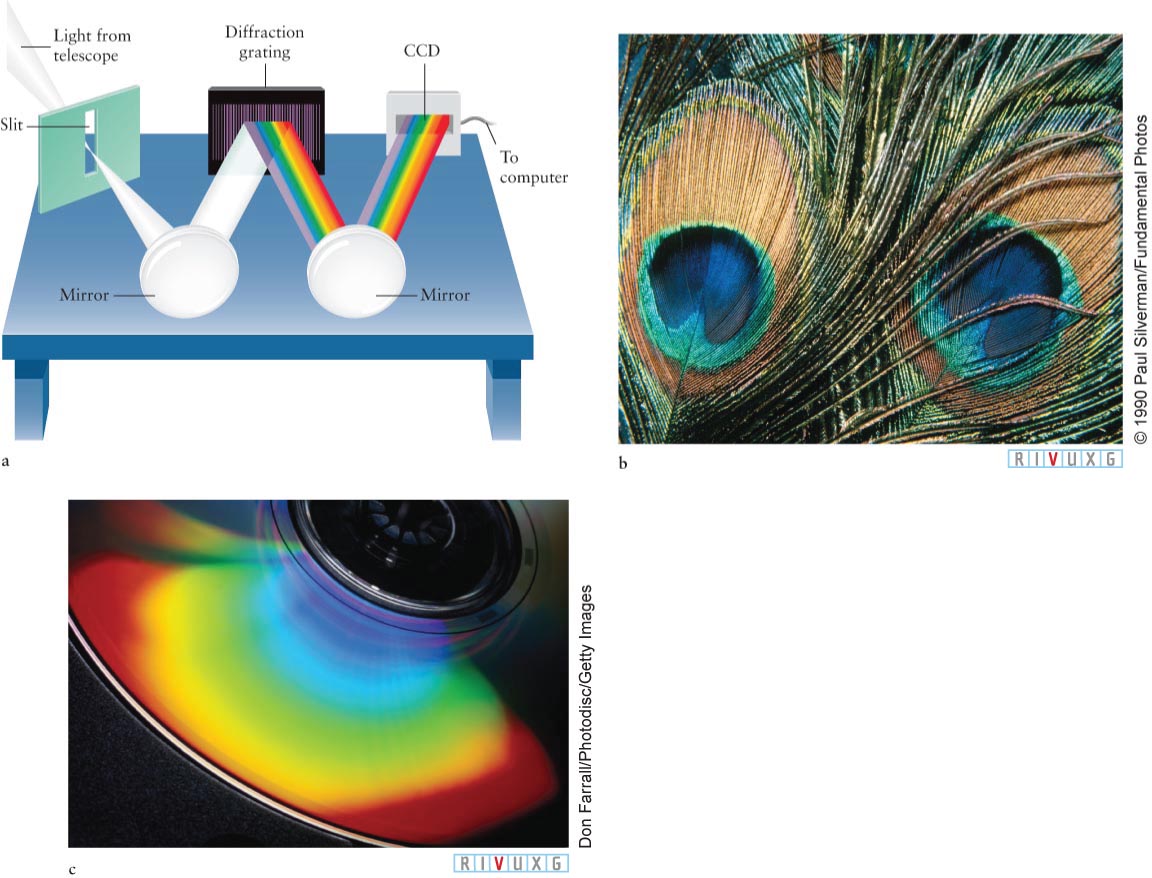 A Grating Spectrograph (a) The diffraction grating in a grating spectrograph has many parallel lines on its surface that reflect light of different colors in different directions. This separation of colors (wavelengths) allows the object’s spectrum to be analyzed. (b) This peacock feather contains numerous natural diffraction gratings. The role of the parallel lines etched in a human-
86
Insight Into Science
Seek Relationships Finding how properties of different things relate to one another often provides invaluable insights into how they work. The periodic table, for example, enables scientists to determine the properties of similar chemical elements. Keep an eye out for other such relationships throughout this book.
Figure 3-
87
The spectral data are converted by computer to a graph that plots light intensity against wavelength. Dark lines in the rainbow-
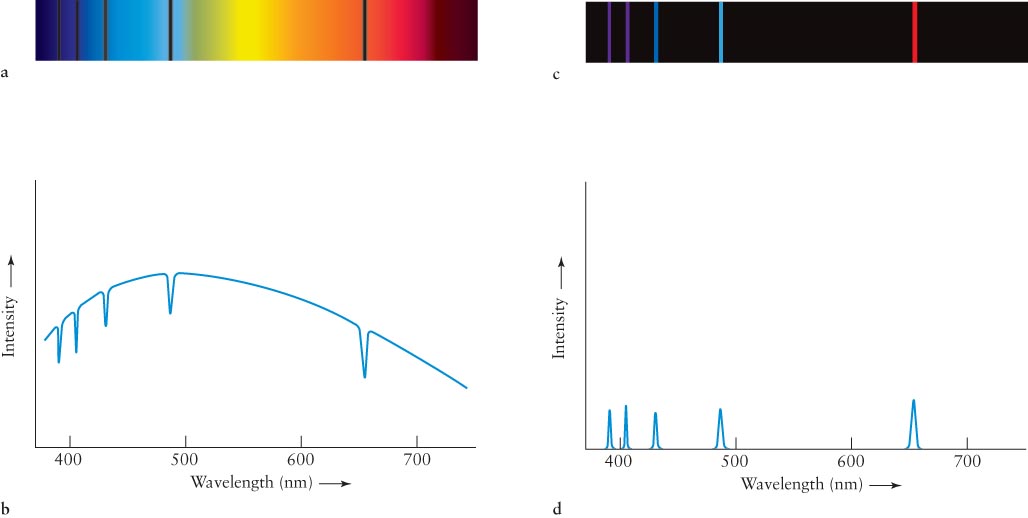
3-15 The various brightness levels of spectral lines depend on conditions in the spectrum’s source
By the early 1860s, Kirchhoff had discovered the conditions under which different types of spectra are observed. His description is summarized today as Kirchhoff’s laws:
Law 1 A solid, liquid, or dense gas produces a continuous spectrum (also called a continuum)—a complete rainbow of colors without any spectral lines. This is a blackbody spectrum.
The light emitted by a hot iron rod and by an incandescent lightbulb are examples of continuous spectra that are bright enough for us to see.
Focus Question 3-12
Diffraction gratings can either reflect or transmit light to create spectra. Are the peacock feathers in Figure 3-
Law 2 A rarefied (opposite of dense) gas produces an emission line spectrum—a series of bright spectral lines against a dark background.
The light emitted by neon lights and by low-
Law 3 The light from an object with a continuous spectrum that passes through a cool gas produces an absorption line spectrum—a series of dark spectral lines among the colors of the rainbow.
Sunlight and the light from other stars pass through several cooler gases on their way to us. Hence, light from stars produces absorption line spectra.
In summary (Figure 3-
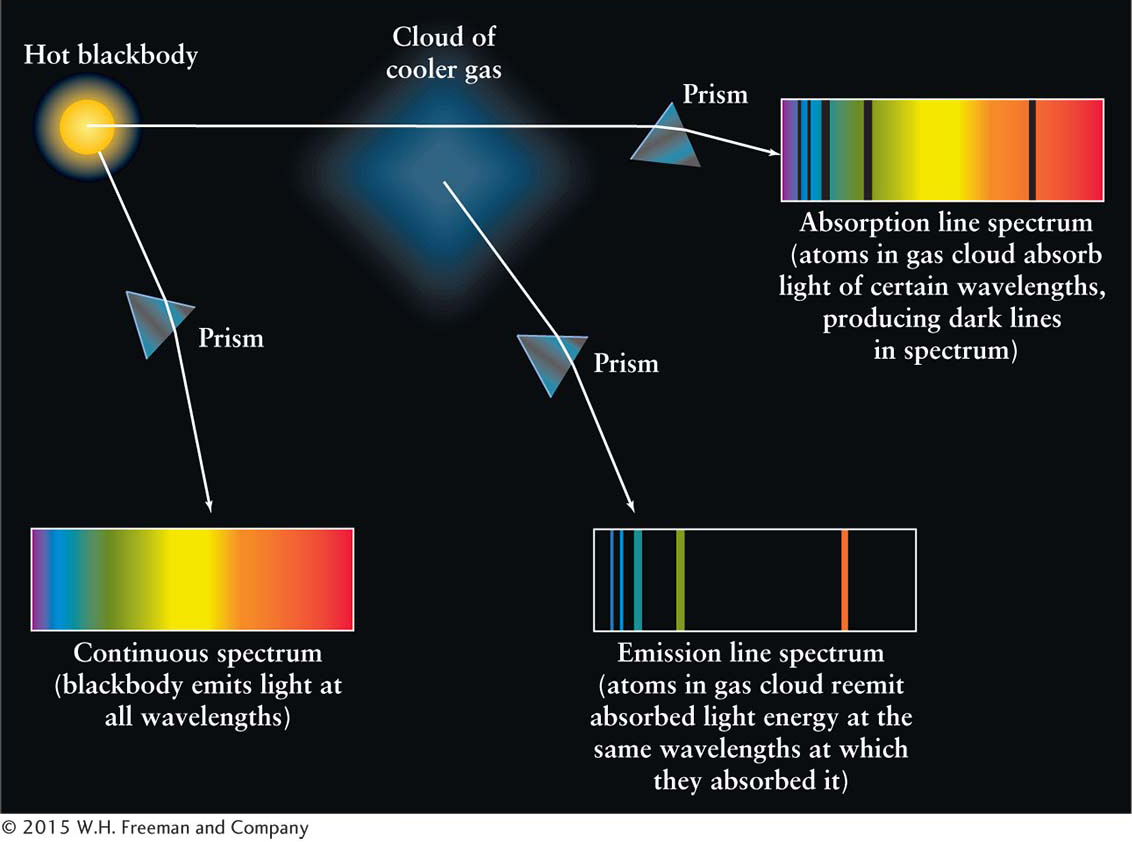
Consider, for example, the spectrum of the Sun. We know that the Sun’s surface emits a continuous blackbody spectrum, but here on Earth many absorption lines are seen in it (see Figure 3-
88
If you have younger siblings or are around children a lot, you are likely to hear them go through a stage of development in which they frequently ask, “Why?” Scientists retain that curiosity, and the appearance of spectra is just one of a myriad of things about which they ask “why?” Fortunately, we can answer this question now, and the insights that it provides will be useful in comprehending concepts in virtually every chapter of this book. Our first step in understanding how spectra arise is to explore the building blocks of matter: atoms.