For Exercises 49–56, software output for confidence intervals for are provided. Assume the conditions are met. For each, examine the indicated software output, and do the following:
- Report the confidence interval in the form “(lower bound, upper bound).”
- Interpret the confidence interval.
- Calculate the margin of error for the confidence interval.
- Interpret the margin of error.
Question 8.148
51. Vegetable Farms. SPSS output, where represents the population mean number of vegetable farms per county, nationwide.
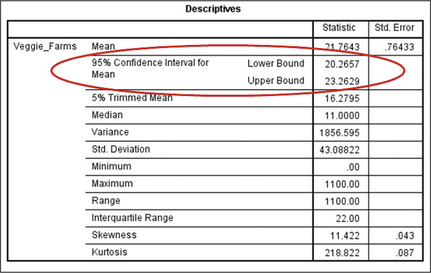
8.2.51
(a) (20.3, 23.3) (b) We are 95% confident that μ, the population mean number of vegetable farms per county for all counties nationwide, lies between 20.3 vegetable farms per county and 23.3 vegetable farms per county. (c) 1.5 vegetable farms per county (d) We can estimate the population mean number of vegetable farms per county for all counties nationwide to within 1.5 vegetable farms per county with 95% confidence.