For Exercises 49–56, software output for confidence intervals for are provided. Assume the conditions are met. For each, examine the indicated software output, and do the following:
- Report the confidence interval in the form “(lower bound, upper bound).”
- Interpret the confidence interval.
- Calculate the margin of error for the confidence interval.
- Interpret the margin of error.
Question 8.152
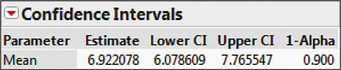
55. Sugar Content in Breakfast Cereal. For the JMP output, represents the population mean amount of sugars, in grams, for all breakfast cereals.
8.2.55
(a) (6.08, 7.77) (b) We are 90% confident that μ, the population mean amount of sugar for all breakfast cereals, lies between 6.08 grams and 7.77 grams. (c) 0.84 gram (d) We can estimate the population amount of sugar for all breakfast cereals to within 0.84 gram with 90% confidence.