Question 8.154
carbon
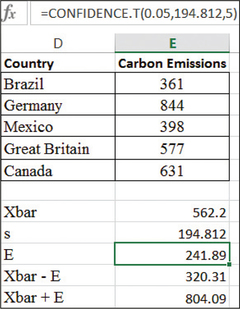
57. Carbon Emissions. The Excel output shows the carbon emissions (in millions of tons) from consumption of fossil fuels for a random sample of five nations.12 The sample mean (using the function “average”) and the sample standard deviation (using the function “stdev”) are also given. The highlighted cell is the margin of error given by the function CONFIDENCE.T, which needs the following values: , , and . Below, the normal probability plot is given.
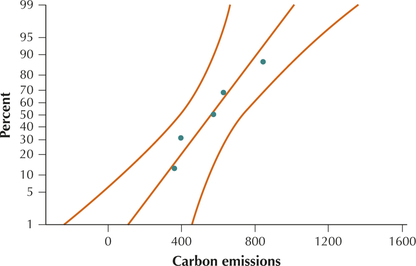
- Check the normality assumption.
- Use the Excel output to report and interpret a 95% confidence interval for the population mean carbon emissions.
- Use the Excel output to report and interpret the margin of error for the confidence interval in part (b).
- Explain two ways we could decrease the margin of error. Which method is preferable, and why?
8.2.57
(a) Acceptable normality (b) (320.31, 804.09). We are 95% confident that μ, the population mean carbon emissions for all nations, lies between 320.31 million tons and 804.09 million tons. (c) million tons; We can estimate the population mean carbon emissions for all nations to within 241.89 million tons with 95% confidence. (d) Decrease the confidence level or increase the sample size. Increase the sample size. The only way to have both high confidence and a tight interval is to boost the sample size.