Cigarette Consumption. Use the following information for Exercises 65–67. Health officials are interested in estimating the population mean number of cigarettes smoked annually per capita in order to evaluate the efficacy of their antismoking campaign. A random sample of eight U.S. counties yielded the following numbers of cigarettes smoked per capita: 2206, 2391, 2540, 2116, 2010, 2791, 2392, 2692.
Question 8.162
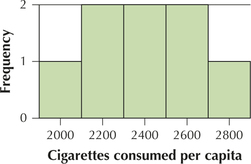
65. Evaluate the normality assumption using the accompanying histogram. Is it appropriate to construct a interval using this data set? Why or why not? What is it about the histogram that tells you one way or the other?
8.2.65
The graph is symmetric about the middle value with the values with the highest frequency in the middle. This indicates that the normality assumption is valid. Since the normality assumption appears to be valid and is unknown, Case 1 applies, so we can use the interval.