Question 8.295
biomass
33. Biomass Power Plants. Power plants around the country are retooling in order to consume biomass instead of, or in addition to, coal. The table21 contains a random sample of eight such power plants and the amount of energy generated in megawatts (MW) in 2014.
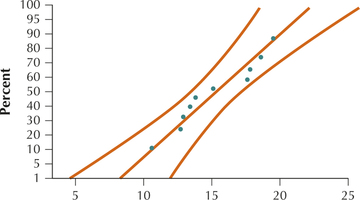
Normal probability plot of energy capacity in megawatts.
| Company | Location | Capacity (MW) |
|---|---|---|
| Hoge Lumber Co. | New Knoxville, Ohio |
3.7 |
| Evergreen Clean Energy | Eagle, CO | 12.0 |
| GreenHunter Energy | Grapevine, TX | 18.5 |
| Covanta Energy Corporation |
Niagara Falls, NY |
30.0 |
| Northwest Energy Systems Co. |
Warm Springs, OR |
37.0 |
| Riverstone Holdings | Kenansville, NC | 44.1 |
| Lee County Solid Waste Authority |
Ft. Myers, FL | 57.0 |
| Energy Investor Funds | Detroit, MI | 68.0 |
| Dominion Virginia Power | Hurt, VA | 83.0 |
Table 8.30: Source: biomassmagazine.com/plants/listplants/biomass/US.
- Check whether the normality condition is met.
- Find the critical values and for a 95% confidence interval for .
- Construct and interpret a 95% confidence interval for the population variance of the MW of energy generated.
- Construct and interpret a 95% confidence interval for the population standard deviation of the MW of energy generated.
8.4.33
(a) Acceptable normality. (b) and
(c) (319.75, 2571.91). We are 95% confident that the population variance lies between 319.75 megawatts squared and 2571.91 megawatts squared.
(d) (17.88, 50.71). We are 95% confident that the population standard deviation lies between 17.88 megawatts and 50.71 megawatts.