Question 8.312
biomass
11. Biomass Power Plants. The table25 contains a random sample of eight biomass-fueled power plants and the amount of energy generated (capacity) in megawatts (MW) in 2014. Construct and interpret a 95% confidence interval for the mean capacity.
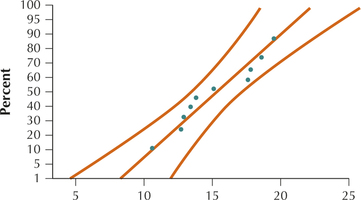
Normal probability plot of energy capacity in megawatts.
| Company | Location | Capacity (MW) |
|---|---|---|
| Hoge Lumber Co. | New Knoxville, Ohio |
3.7 |
| Evergreen Clean Energy | Eagle, CO | 12.0 |
| GreenHunter Energy | Grapevine, TX | 18.5 |
| Covanta Energy Corporation |
Niagara Falls, NY | 30.0 |
| Northwest Energy Systems Co. |
Warm Springs, OR | 37.0 |
| Riverstone Holdings | Kenansville, NC | 44.1 |
| Lee County Solid Waste Authority |
Ft. Myers, FL | 57.0 |
| Energy Investor Funds | Detroit, MI | 68.0 |
| Dominion Virginia Power | Hurt, VA | 83.0 |
Table 8.35: Source: biomassmagazine.com/plants/listplants/biomass/US.
8.99.11
(18.91, 59.61)