For Exercises 43–46, software output from a confidence interval for is provided. For each, examine the indicated software output, and do the following:
- Report the confidence interval in the form “(lower bound, upper bound).”
- Interpret the confidence interval.
- Calculate the margin of error for the confidence interval.
- Interpret the margin of error.
Question 8.45
45. Minitab output, where represents the population mean GPA of college freshmen.
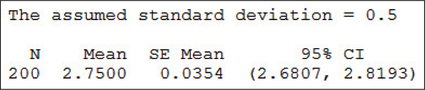
8.1.45
(a) (2.6807, 2.8193) (b) We are 95% confident that the population mean lies between 2.6807 and 2.8193. (c) 0.0693 (d) We can estimate the population mean to within 0.0693 with 95% confidence.