For Exercises 65–68, software output from a confidence interval for is provided. For each, examine the indicated software output, and do the following:
- Report the confidence interval in the form “(lower bound, upper bound).”
- Interpret the confidence interval.
- Find the margin of error for the confidence interval.
- Interpret the margin of error.
Question 8.65
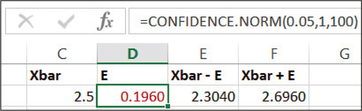
65. Grade Point Averages. In the Excel output, the CONFIDENCE.NORM function gives the margin of error, using the following values: , the population standard deviation, and the sample size (0.05, 1, and 100, respectively). Here, represents the population mean grade point average for college students.
446
8.1.65
(a) (2.3040, 2.6960) (b) We are 95% confident that the population mean lies between 2.3040 and 2.6960. (c) 0.1960 (d) We can estimate the population mean to within 0.1960 with 95% confidence.