Question 8.69
carbon
69. Carbon Emissions. The following table represents the carbon emissions (in millions of tons) from consumption of fossil fuels for a random sample of five nations.3 Assume .
| Nation | Emissions |
|---|---|
| Brazil | 361 |
| Germany | 844 |
| Mexico | 398 |
| Great Britain | 577 |
| Canada | 631 |
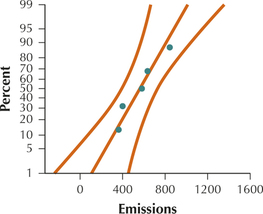
- Assess the normality of the data, using a normal probability plot. (Hint: See page 381.) Confirm that the conditions for constructing a interval are met.
- Assuming that carbon emissions are normally distributed, construct and interpret a 90% confidence interval for the population mean carbon emissions.
- Calculate and interpret the margin of error for the confidence interval in part (b).
- How large a sample size do we need to estimate to within 50 million tons with 90% confidence?
8.1.69
(a) The normal probability plot indicates an acceptable level of normality.
(b) (415.067, 709.333); TI-83/84: (415.08, 709.32). We are 90% confident that the population mean carbon emissions lies between 415.067 (415.08) million tons and 709.333 (709.32) million tons. (c) million tons. We can estimate the population mean emissions level of all nations to within 147.133 million tons with 90% confidence. (d) 44 nations