STEP-BY-STEP TECHNOLOGY GUIDE: Confidence Intervals and Hypothesis Tests for μd
TI-83/84
Hypothesis Test
(Example 3 is used to illustrate the procedure.)
- Step 1 Enter samples 1 and 2 in lists L1 and L2. Press 2nd > Quit.
- Step 2 Type (L1 – L2) STO→ L3 and press ENTER (Figure 4).
- Step 3 Press STAT and highlight TESTS.
- Step 4 For the hypothesis test, press 2 (for the T-Test). The T-Test menu appears.
- Step 5 For input (Inpt), highlight Data and press ENTER. (If given the summary statistics for the differences, choose Stats.)
- Step 6 For μ0, enter the hypothesized value, 0. For List, press 2nd then L3. For Freq, enter 1. Choose the form of the hypothesis test, and press ENTER (Figure 5).
- Step 7 When the cursor is over Calculate, make sure all your entries are correct, and press ENTER. The results are shown in Figure 6.
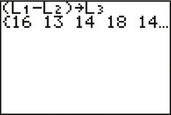 Figure 10.4: FIGURE 4
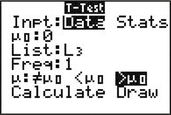 Figure 10.5: FIGURE 5
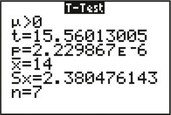 Figure 10.6: FIGURE 6
Confidence Interval
(Example 5 is used to illustrate the procedure.)
- Step 1 Enter samples 1 and 2 in lists L1 and L2.
- Step 2 Type (L1 – L2) STO→ L3 and press ENTER (Figure 4).
- Step 3 Press STAT and highlight TESTS.
- Step 4 Press 8 (for the TInterval).
Step 5 For input (Inpt), highlight Data and press ENTER. (If given the summary statistics for the differences, choose Stats.)
585
- Step 6 For List, press 2nd then L3. For Freq, enter 1. Enter the C-Level (confidence level, such as 0.95 for 95%), and press ENTER (Figure 7).
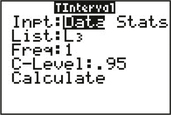 Figure 10.7: FIGURE 7
 - Step 7 Highlight Calculate and press ENTER. The results are shown in Figure 8.
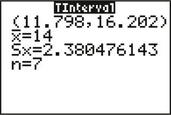 Figure 10.8: FIGURE 8
EXCEL
Hypothesis Test
- Step 1 Enter samples 1 and 2 in columns A and B.
- Step 2 Click Data > Data Analysis > t-Test: Paired Two Sample for Means, and click OK.
- Step 3 For Variable 1 Range, highlight the cells for sample 1 in column A, and for Variable 2 Range, highlight the cells for sample 2 in column B.
- Step 4 Enter the Hypothesized Mean Difference (usually 0), and enter a value for alpha. Then click OK.
MINITAB
Confidence Interval and Hypothesis Test
- Step 1 Enter samples 1 and 2 in columns C1 and C2.
- Step 2 Click Stat > Basic Statistics > Paired t….
- Step 3 Select Each sample is in a column from the drop-down menu. For Sample 1, enter C1, and for Sample 2, enter C2.
- Step 4 Click Options.
- For the confidence interval, specify the Confidence Level, then click OK twice.
- For the hypothesis test, specify the form of the alternative hypothesis, then click OK twice.
SPSS
Confidence Interval and Two-Tailed Hypothesis Test
(Example 5 is used to illustrate the procedure.)
- Step 1 Enter the data into the first two columns.
- Step 2 Select Analyze > Compare Means > Paired-Samples T Test….
- Step 3 Move the first variable to Variable 1 in the Paired Variables table, and move the second variable to Variable 2.
- Step 4 Click Options…, and enter the Confidence Interval Percentage. Click Continue, then click OK. The results are located in the Paired Samples Test table of the output window, shown in Figure 9.
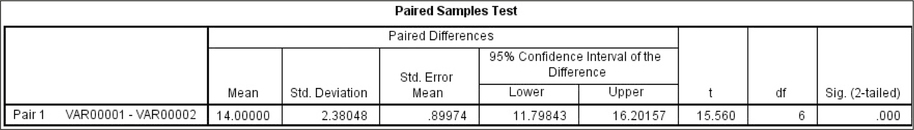
Figure 10.9: FIGURE 9 SPSS results.
JMP
Confidence Interval and Hypothesis Test
(Example 5 is used to illustrate the procedure.)
- Step 1 Click File > New > Data Table. Enter the data into the first two columns.
- Step 2 Select Analyze > Matched Pairs. Move both variables to the Y, Paired Response box. Click OK. The t test results and the 95% confidence interval are shown in Figure 10.
- Step 3 To change the confidence level of the confidence interval, click the red triangle next to Matched Pairs, click Set α level, and select the desired level of α.
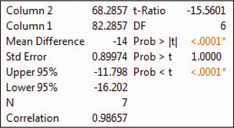 Figure 10.10: FIGURE 10 JMP results.
586
CRUNCHIT!
Paired t test and t interval for μd.
We will use the data from Example 3.
- Step 1 Click File, then highlight Load from Larose, Discostat3e > Chapter 10, and click on Example 01_03.
- Step 2 Click Statistics, highlight t, and select Paired. For First Variable, select After. For Second Variable, select Before.
- For the hypothesis test, select the Hypothesis Test tab, enter the Mean difference under null hypothesis, choose the correct form of the Alternative hypothesis, and click Calculate.
- For the confidence interval, select the Confidence Interval tab, enter the Confidence Interval Level (%), and click Calculate.